
How industrial benchmarking reveals hidden production bottlenecks


A production bottleneck is rarely located where output visibly slows. A delayed assembly cell, a queue before inspection, or a machine with low utilization may be the symptom of a constraint created earlier in the process: unstable incoming material, excessive changeover variation, an inspection algorithm generating false rejects, delayed vacuum recovery, or a planning rule that overloads one resource while starving another.
Industrial benchmarking makes these hidden constraints visible by comparing a production system against a controlled reference: its own best-performing operating window, a comparable line, a validated process specification, or an applicable standard. The purpose is not to rank factories on a generic scorecard. It is to establish which deviations are operationally meaningful, where they originate, and which intervention will improve the economics of the whole production flow rather than merely improving one machine’s local metric.
That distinction matters because many improvement programs optimize what is easiest to measure. Cycle time, utilization, yield, downtime, and scrap are useful indicators, but they become misleading when separated from product mix, material condition, inspection rules, maintenance state, and the capability of upstream and downstream operations. A disciplined industrial benchmarking process connects those variables before capital is committed to additional equipment or automation.
Why the apparent bottleneck is often not the real one
Consider a laser processing line where the cutting station appears to limit throughput. The instinct may be to specify a higher-power laser source or add a second machine. Yet the constraint may lie in nesting quality, material handling, nozzle condition, assist-gas consistency, or manual sorting after cutting. If parts leave the laser quickly but accumulate before bending because their edge quality requires rework, increasing cutting capacity expands work-in-process without improving shipment performance.
The same pattern appears in additive manufacturing. A metal printer may show a long build time, but the commercially relevant lead time can be dominated by build preparation, powder handling, heat treatment, support removal, surface finishing, dimensional inspection, or documentation release. Benchmarking only the printer’s deposition rate gives an incomplete answer. The relevant unit of comparison is the qualified part released to the next operation, with its required mechanical properties, geometry, traceability, and cost.
In machine vision applications, a high inspection reject rate does not automatically mean that production quality has deteriorated. It may reveal a change in illumination, lens contamination, fixture wear, part orientation, image threshold settings, or a model that was calibrated on an unrepresentative sample set. Treating all reject signals as process failures can drive unnecessary adjustments and obscure the actual source of variation.
Hidden bottlenecks emerge because manufacturing systems are coupled. A local gain can shift pressure to another stage, while variability at one point can create disproportionate losses later. Industrial benchmarking should therefore follow the path of value creation: material release, processing, transfer, verification, rework, and final acceptance. The central question is not “Which asset is slow?” but “Which condition most reliably limits the rate at which conforming output reaches the customer?”
A benchmark must be comparable before it is useful
Comparisons fail when they place unlike conditions in the same dataset. A machine producing small batches with frequent changeovers cannot be judged directly against one running a stable, high-volume part family. A vacuum process handling different chamber loads, contamination profiles, or thermal cycles cannot be assessed using a single pump-down-time target. A vision system inspecting reflective surfaces cannot be benchmarked against one evaluating matte, high-contrast components without accounting for optical conditions.
The first discipline is to define the comparison boundary. That usually requires separating results by the variables that materially affect performance:
- part family, material grade, and incoming material condition;
- approved process route and required quality level;
- batch size, setup frequency, and operator intervention;
- tooling, fixtures, consumables, and software or recipe version;
- environmental factors such as temperature, humidity, cleanliness, vibration, or gas supply stability;
- planned production time versus time unavailable for maintenance, qualification, engineering trials, or product changeovers.
Without this normalization, averages conceal the mechanism that needs attention. For example, an apparently acceptable average cycle time may include a small number of long recovery events that repeatedly disrupt downstream scheduling. Median performance can be equally deceptive if a process has a long tail of failures. The benchmark must show both central performance and variation: how often the process meets its expected window, how severe deviations are, and how long recovery takes.
External references also need careful interpretation. Industry data can establish a useful range, but it cannot replace a site-specific operating baseline. Process architecture, product tolerance, labor model, qualification requirements, and maintenance strategy differ too widely for a generic “best practice” figure to serve as a target by itself. The strongest benchmark combines external engineering knowledge with internally verified evidence from comparable products and conditions.
Build the measurement chain before comparing performance
Production data are often abundant but not decision-ready. Machine controllers may record alarms and run time; manufacturing execution systems may track work orders; quality systems may hold nonconformance data; maintenance records may document interventions; and enterprise systems may report cost or delivery performance. If these sources use different asset identifiers, timestamps, part revisions, or definitions of downtime, their numbers cannot be reliably combined.
A practical benchmark begins with a common event model. Each part, batch, or production order should be associated, where relevant, with the process recipe, equipment identity, tool or fixture, operator or automation state, material lot, inspection result, rework status, and release decision. The level of detail depends on the process. Recording every signal is not the objective; preserving the variables needed to distinguish cause from coincidence is.
This is where established reference frameworks can help. ISO 22400 provides definitions for key performance indicators used in manufacturing operations management, while IEC 62264 provides a framework for integrating enterprise and control systems. These do not prescribe a single operational target. Their value lies in reducing ambiguity around what is being measured and how production information is connected across levels of the organization.
Definitions deserve executive attention because a dashboard can look precise while mixing incompatible categories. “Availability,” for example, may exclude certain planned stops in one area and include them in another. “Yield” may be calculated at first-pass inspection in one line but after rework in another. “Capacity” may mean theoretical equipment time, scheduled time, or qualified output under actual product conditions. A benchmark built on inconsistent definitions can lead to a confidently wrong investment decision.
Use throughput, quality, and reliability together
Single-metric optimization is one of the most persistent sources of false improvement. Overall equipment effectiveness can be useful as a diagnostic framework because it combines availability, performance, and quality. It becomes less useful when it is treated as a universal measure of business performance. Raising utilization by extending batch size may reduce flexibility and increase inventory. Improving first-pass yield by loosening inspection sensitivity may transfer defects to the customer. Reducing downtime by postponing maintenance may increase the severity of later failures.
A more informative benchmark links four dimensions:
These dimensions expose different forms of constraint. A process with strong uptime but poor conforming throughput may be running parts that later fail inspection. A line with high yield but poor flow efficiency may be constrained by batching, transport, approvals, or an overburdened metrology step. A cell with acceptable average output but weak reliability may create planning risk that is more costly than its average performance suggests.
Where benchmarking changes decisions in advanced production environments
In industrial laser processing, the useful comparison is often the relationship between energy delivery, beam condition, focus stability, speed, assist gas, material surface condition, and achieved edge or weld quality. A nominal laser power rating alone cannot explain why one shift produces more rework than another. Benchmarking process windows against quality outcomes can separate a capacity issue from a process-control issue. It may show that the limiting factor is not source power but a narrow stable operating window caused by optics condition, fixture repeatability, or material variation.
For additive manufacturing, benchmarks should extend beyond build rate. Layer time, recoater interruptions, oxygen level, powder reuse rules, thermal history, post-processing queue time, and inspection outcomes determine the effective output of a qualified production system. A faster build parameter set that increases support-removal difficulty or dimensional correction requirements may not improve delivered capacity. The operational benchmark must follow the part through the complete validated route.
Machine vision and optical inspection require a further distinction between detection performance and production consequence. False positives consume engineering and re-inspection capacity; false negatives create escape risk. The relevant benchmark evaluates repeatability, reproducibility, defect-detection performance under representative variation, and the workload created by the review process. When inspection becomes the bottleneck, the answer may be improved imaging, fixture control, classification logic, or a better escalation rule—not simply a faster camera.
In vacuum and cryogenic engineering, recovery curves can be more revealing than endpoint values. A chamber may eventually reach the required pressure while taking too long because of leaks, outgassing, moisture load, seal degradation, inadequate bake-out, or changes in chamber loading. Benchmarking the full pump-down profile, base-pressure stability, leak-check results, and cycle-to-cycle variation helps distinguish normal process behavior from deterioration. The decision may concern maintenance timing, materials handling, chamber design, or process scheduling rather than pumping capacity alone.
Turn deviations into an intervention sequence
Once a bottleneck is identified, the next risk is acting on correlation rather than mechanism. A useful intervention sequence tests whether the suspected constraint actually governs system output. If an inspection station is believed to be limiting flow, temporarily increasing its capacity or reducing its review burden should produce a measurable downstream change. If it does not, the queue may be a consequence of upstream variability or release rules rather than the true constraint.
The preferred order of action is usually to stabilize the current constraint before expanding it. Stabilization can include tighter recipe control, preventive replacement of consumables, better material segregation, fixture improvements, clearer escalation rules, calibration checks, revised maintenance intervals, or removal of avoidable approval delays. These actions frequently provide more reliable gains than adding capital to an unstable process.
Only after the constraint is stable should capacity expansion be assessed. The business case should include the full effect on downstream operations: tooling, staffing, inspection capacity, utilities, software integration, validation, spare parts, training, and the additional working capital created by altered batch sizes or inventory patterns. A machine-level return calculation that ignores those dependencies can overstate the value of the investment.
Benchmarking is most valuable when it becomes a control discipline
Industrial benchmarking should not end with a one-time comparison report. Production systems change when product mix shifts, suppliers change materials, software is updated, tooling wears, maintenance practices evolve, or quality requirements tighten. A benchmark that is not refreshed eventually becomes a historical description rather than a decision tool.
The most useful operating model preserves a controlled baseline, documents approved changes, and reviews deviations at the point where technical evidence and production consequences meet. That allows a business to distinguish random fluctuation from a developing constraint, and to see whether a local improvement has genuinely increased conforming output across the full route.
The practical value is not a higher benchmark score. It is the ability to avoid misdirected capital expenditure, protect delivery reliability, and focus engineering effort on the conditions that actually govern profitable production. When benchmarking is built around comparable operating conditions and end-to-end flow, hidden bottlenecks stop being vague explanations for underperformance and become testable operational decisions.
Related News
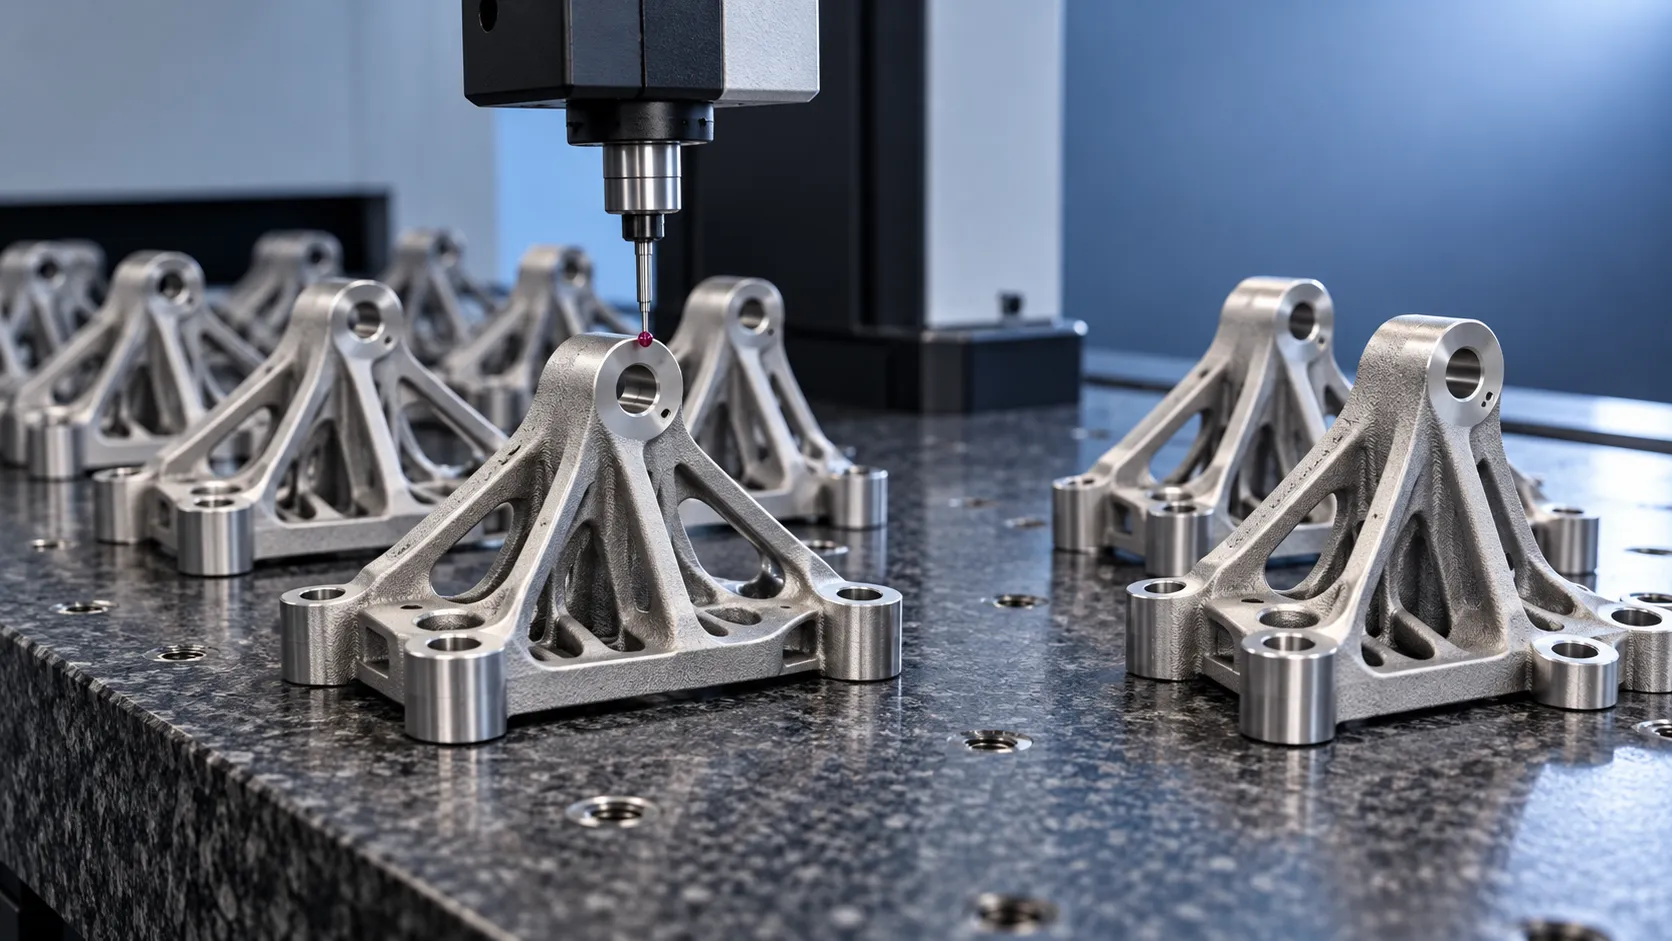
How to verify part consistency before choosing a 3D printing OEM
Choosing a 3D printing OEM? Learn how to verify part consistency with repeat-build trials, validated inspections, and traceability checks before committing to production.
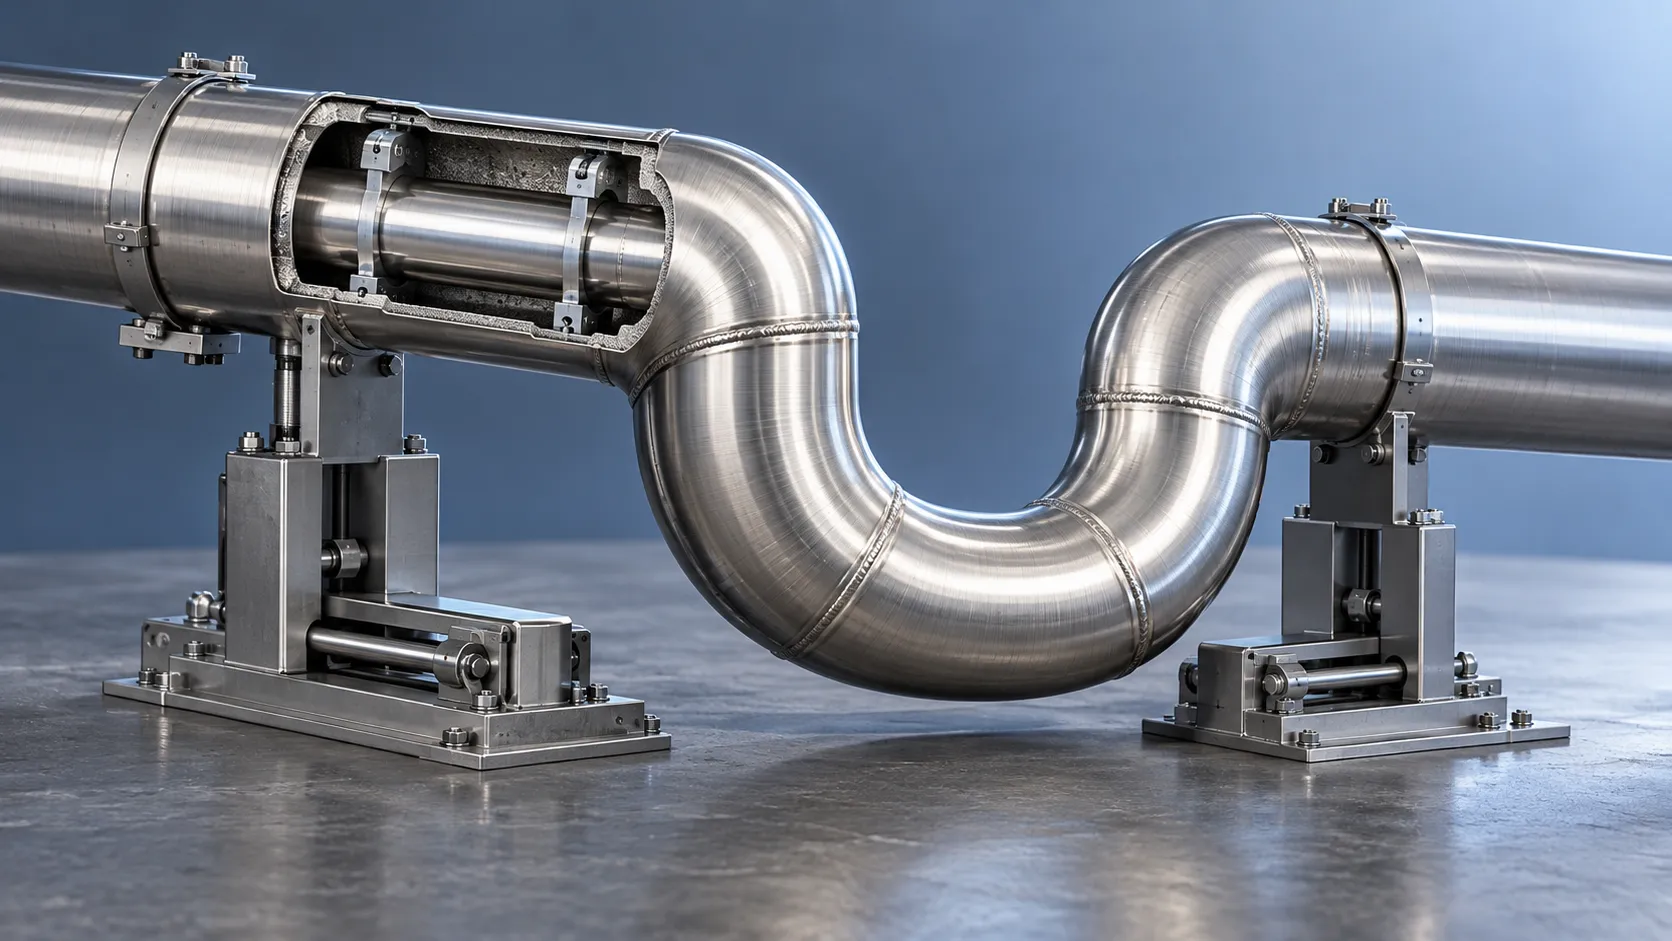
How does a rigid cryogenic transfer line handle thermal contraction?
Learn how a rigid cryogenic transfer line manages thermal contraction with bends, bellows, and guided supports. Discover key design checks for safe, reliable cryogenic performance.

How much does edge vision deployment cost beyond the hardware?
Understand edge vision deployment cost beyond hardware, from data and integration to security and support. Uncover hidden expenses and build a smarter lifecycle budget before you scale.

How does the purity of sputtering targets affect thin-film quality?
Discover how sputtering targets affect thin-film quality. Learn to assess purity, identify harmful impurities, and choose specifications that improve coating performance.

How high power laser cladding systems control substrate dilution
Discover how high power laser cladding systems control substrate dilution through beam shaping, material feed, and thermal management to deliver reliable bonds and coating performance.

How to check HS codes for customs compliance in international logistics
Strengthen international logistics customs compliance: learn how to verify HS codes, check official tariffs, and document classifications to reduce costly shipment delays.

Choosing a 3D Printing Service for Consumer Products: Finish, Fit, and Cost
Compare 3d printing consumer good services by finish, fit, materials, and total cost. Learn how to choose a reliable supplier and avoid costly defects before ordering.

Which Consumer Goods Can Be 3D Printed, and What Are the Practical Limits?
Explore 3d printing consumer goods, from custom eyewear to replacement parts. Discover practical limits on materials, safety, and costs to make smarter production decisions.

From Prototype to Small Batch: Applying 3D Printing to Consumer Goods
Explore 3d printing in consumer goods: learn how to move from prototype to small-batch production with practical guidance on materials, quality validation, and cost control.
Related News
- 00
0000-00
How to verify part consistency before choosing a 3D printing OEM - 00
0000-00
How does a rigid cryogenic transfer line handle thermal contraction? - 00
0000-00
How much does edge vision deployment cost beyond the hardware? - 00
0000-00
How does the purity of sputtering targets affect thin-film quality? - 00
0000-00
How high power laser cladding systems control substrate dilution
Dr. Hideo Tanaka
Weekly Insights
Stay ahead with our curated technology reports delivered every Monday.