
How to evaluate an SWCNT manufacturer’s purity specifications


A stated purity of 95%, 99%, or even higher is not enough to determine whether single-walled carbon nanotubes (SWCNTs) are suitable for a demanding formulation, electronic component, composite, coating, or sensor platform. The number only becomes meaningful when the manufacturer can show what was measured, which fraction of the material it represents, how non-SWCNT carbon was separated from catalyst residue, and how consistently the result is reproduced across lots.
Purity specifications are especially easy to overinterpret because SWCNT material is structurally heterogeneous by nature. A commercial powder may contain semiconducting and metallic nanotubes, residual catalyst metals, support-derived oxides, amorphous carbon, graphitic particles, carbonaceous encapsulation around catalyst particles, moisture, and process residues. Two materials both described as “high-purity SWCNTs” can therefore behave very differently in dispersion, conductivity, optical absorption, thermal stability, or device fabrication.
The relevant question is not “Which SWCNT manufacturer reports the highest purity?” It is “Does the reported purity definition correspond to the impurity profile and performance risk of the intended application?”
Start by separating the purity claims
Suppliers may use “purity” to describe several different properties. These should never be treated as interchangeable.
- SWCNT carbon purity refers to the proportion of carbonaceous material attributed to single-walled nanotubes rather than amorphous carbon, multilayer nanotubes, graphite-like particles, or other carbon forms.
- Metal purity, or more precisely low residual metal content, refers to the amount of catalyst-derived elements remaining after synthesis and purification. Common catalyst systems may include Fe, Co, Ni, Mo, or combinations of these elements.
- Total ash content measures non-combustible residue after controlled thermal treatment. It is a useful screening value, but it does not identify the chemical composition or location of the residue.
- Semiconducting-enriched or metallic-enriched content is a chirality or electronic-type distribution claim, not a general purity claim. A sample can have low metal residue yet contain a broad mixture of metallic and semiconducting SWCNTs.
- Carbon nanotube content may refer broadly to nanotube material, without distinguishing SWCNTs from double-walled or multi-walled carbon nanotubes.
A certificate stating “99% purity” without naming the analyte, test method, basis of calculation, and detection limits does not provide a usable qualification datum. The figure might exclude volatile matter, be derived from a model-dependent spectral deconvolution, or represent only a selected subsample.
A strong specification identifies the measurement basis in direct language: for example, “residual Fe by ICP-OES after microwave digestion, reported in mg/kg,” or “thermogravimetric residue in air under stated temperature ramp and hold conditions.” That does not automatically prove application fitness, but it makes the claim auditable.
Match the impurity profile to the failure mechanism
Purity requirements should be driven by what the impurities can do in the end system. A low total impurity level is not always sufficient when one impurity is disproportionately harmful.
Residual transition metals are often the first concern. In conductive inks, polymer composites, or antistatic coatings, small metal residues may have limited practical effect if the product does not face electrochemical, optical, or catalytic constraints. In contrast, metals can be unacceptable in semiconductor processing, high-reliability electronics, electrochemical devices, biomedical research, or systems where catalytic activity changes the host material. Fe, Co, and Ni can affect oxidation behavior, electrochemical background signals, corrosion pathways, and long-term stability.
Non-nanotube carbon presents a different risk. Amorphous carbon can raise surface area, alter rheology, consume dispersant, and create unstable agglomerates. Graphitic particles and carbonaceous debris may increase apparent conductivity while reducing film uniformity or optical clarity. In transparent conductive films, sensor coatings, and printed electronics, these effects can matter more than a modest difference in metal content.
In some applications, the decisive variable is not chemical contamination but morphology. Bundling, short fragments, oversized agglomerates, or wide length distributions can cause filtration problems, nozzle clogging, poor percolation control, and inconsistent coating quality. These are not normally captured by a headline purity percentage. A material can be chemically clean but operationally unsuitable because its dispersion state is poorly controlled.
Ask how each purity value was measured
No single analytical method can characterize SWCNT purity completely. Reliable supplier evaluation relies on complementary techniques, with each method used within its limits.
ICP-OES or ICP-MS for residual metals
Inductively coupled plasma optical emission spectrometry (ICP-OES) and inductively coupled plasma mass spectrometry (ICP-MS) are the most useful tools for quantifying catalyst-derived elements, provided sample digestion is validated. The report should identify the elements tested, the digestion approach, units, and whether the result is reported on an as-received or dry basis.
The digestion method matters because nanotube-containing powders can be difficult to dissolve completely. Incomplete digestion may understate the metal concentration, particularly when metal particles are encapsulated by graphitic shells. A credible analytical package should therefore specify sample preparation rather than listing only an elemental result.
Ask for individual elemental values instead of a single “metal content” total. A total can conceal a problematic metal or prevent comparison with application-specific restrictions. It is also useful to know whether elements such as sulfur, chlorine, sodium, calcium, aluminum, or silicon are monitored when they may originate from purification reagents, processing aids, vessel wear, or substrate-derived contamination.
TGA for ash and oxidation behavior
Thermogravimetric analysis (TGA) in air or oxygen-containing gas can provide a fast view of residual inorganic content and carbon oxidation behavior. The final residue is often used as a proxy for ash content. The oxidation profile may also reveal multiple carbon populations: loosely ordered carbon can oxidize at lower temperatures than more graphitized material, while catalyst residues can alter apparent oxidation temperatures.
However, TGA does not directly identify the residue, distinguish SWCNTs from all other carbon allotropes, or produce a universal purity percentage. Heating rate, gas composition, sample mass, pan type, baseline correction, and end temperature can materially affect the curve. A supplier chart without test conditions should be treated as indicative rather than comparative evidence.
For lot qualification, request the full thermogram and derivative weight-loss curve, not only a residual-ash number. The shape of the curve can be more informative than the final percentage when comparing lots from the same source.
Raman spectroscopy for nanotube quality indicators
Raman spectroscopy is central to SWCNT assessment because it provides information on radial breathing modes, the D band, G band, and, under suitable excitation conditions, features associated with nanotube structure and disorder. The D-to-G intensity ratio is commonly used as a qualitative indicator of defect-related disorder.
It should not be converted automatically into a purity claim. Raman response depends on laser wavelength, resonance effects, sample preparation, nanotube diameter and chirality distribution, bundling, background subtraction, and the fitting approach. A low D/G ratio may indicate relatively ordered nanotube walls, but it does not quantify catalyst residues or rule out non-resonant carbonaceous impurities.
Meaningful comparison requires the same excitation wavelength, acquisition conditions, normalization approach, and spectral fitting procedure. If a supplier supplies Raman data from a single spot, it does not establish lot homogeneity. Mapping across multiple locations or reporting replicate measurements is more relevant for qualification.
Microscopy and spectroscopy for morphology and identity
Transmission electron microscopy (TEM) can visually confirm single-walled tube structures, bundles, catalyst particles, and obvious non-tubular carbon. Scanning electron microscopy (SEM) is helpful for larger-scale morphology and agglomeration, although it does not resolve individual SWCNT walls in the same way as TEM. Energy-dispersive X-ray spectroscopy (EDS) can locate some heavier elemental residues, but it is generally semi-quantitative and should not replace bulk ICP analysis.
X-ray photoelectron spectroscopy (XPS) is surface-sensitive. It can identify surface elemental chemistry and oxidation states, but its shallow sampling depth means it may miss encapsulated metals or bulk contamination. Ultraviolet-visible-near-infrared (UV-Vis-NIR) absorption can provide useful information on electronic transitions and dispersion quality, particularly for sorted or dispersed materials, yet interpretation depends strongly on the sample state and processing history.
These methods are most valuable when their roles are kept distinct: microscopy establishes visual evidence, bulk elemental analysis quantifies metals, thermal analysis screens inorganic residue and oxidation behavior, and spectroscopic methods assess structure or surface chemistry.
Check whether the specification refers to powder, dispersion, or finished intermediate
Purity data is frequently transferred from a precursor powder to a commercial dispersion without adequate verification. This can create a false equivalence. A dispersion may contain surfactants, polymers, solvents, salts, stabilizers, or intentionally added functional agents. Its solids fraction may also differ between batches. Those components influence TGA, Raman background, ash measurements, elemental results, and performance testing.
For a dispersion, the manufacturer should clarify:
- the SWCNT concentration and method used to determine it;
- the identity or disclosure category of dispersants and additives;
- whether residual metal data applies to the original nanotube powder or the supplied dispersion;
- how solids are isolated, dried, and corrected for non-nanotube components before testing;
- the filtration, centrifugation, or deagglomeration steps that may change the delivered morphology.
The same distinction applies to functionalized SWCNTs. Oxidation, carboxylation, polymer wrapping, covalent modification, and other treatments may improve compatibility while changing mass balance, thermal behavior, Raman features, and electronic properties. The appropriate metric is then not simply maximum SWCNT percentage. It is controlled functionalization combined with limits on contaminants that interfere with the intended chemistry.
Batch consistency is part of the specification, not a separate commercial issue
A favorable characterization package from one development sample does not demonstrate manufacturing control. SWCNT synthesis and purification can be sensitive to catalyst preparation, reactor conditions, feedstock composition, residence time, post-treatment severity, washing efficiency, and drying. Small process shifts can change impurity distribution without causing an obvious change in the headline product description.
Evaluate whether a supplier provides lot-specific certificates of analysis, rather than a generic product data sheet. A technically useful certificate should include lot number, production or release date, analytical method references, acceptance limits, actual measured values, and units. “Pass” statements without numerical results are difficult to benchmark.
Where supply continuity matters, compare data from several independent lots. The purpose is not to demand identical curves or spectra; normal measurement variation exists. The objective is to determine whether the material remains inside an application-relevant operating window. For example, a stable residual-metal range may matter more than the lowest observed metal result, while consistent dispersibility and electrical behavior may matter more than a narrowly optimized Raman ratio.
It is also reasonable to ask which values are controlled as release criteria and which are informational characterization results. A graph included in a technical brochure may be representative. A release criterion is a manufacturing commitment. The distinction materially changes the value of the specification.
Do not confuse a test report with method validation
Third-party reports can improve confidence, but their value depends on sampling integrity and method relevance. An external laboratory may accurately measure the sample submitted while providing no evidence that the sample represents routine production. The report should identify sample custody, laboratory method, calibration practice where relevant, and the tested lot.
For critical applications, align the incoming inspection method with the supplier’s method before setting acceptance limits. A buyer using one TGA protocol and a manufacturer using another may generate different ash results from the same material. The same issue arises with Raman excitation wavelength, ICP digestion, and sample drying conditions. Without method alignment, apparent supplier nonconformance may be analytical mismatch.
Recognized frameworks can support the quality system around the measurement. ISO/IEC 17025 accreditation is relevant to laboratory competence for the accredited scope, but it does not validate every method or establish that a material is suitable for every use. ASTM and ISO standards may be relevant to specific test procedures, yet no single standard replaces a material-specific qualification plan for SWCNTs.
Build an evidence package around the intended use
A practical evaluation file should connect each impurity concern to a measurable control. For catalyst-sensitive applications, request lot-level ICP data for relevant metals and define maximum limits in the purchase specification. For conductive or optical films, combine chemical purity evidence with dispersion quality, sheet resistance, transmittance, coating uniformity, and particle-defect inspection. For polymer compounding, include ash, moisture or volatile content where relevant, dispersion behavior in the target matrix, and a processing-representative performance test.
Incoming checks do not need to repeat every advanced characterization technique. A sensible approach is to use a small number of rapid release tests correlated to more comprehensive periodic verification. The correlation must be established rather than assumed. For instance, a Raman ratio alone should not be used as a surrogate for low residual metal content unless a documented relationship has been demonstrated for that specific material and process.
Purchasing language should also avoid ambiguous commitments such as “ultra-high purity” or “minimal catalyst residue.” Define the material form, dry-basis convention, target analytes, analytical method, reporting units, sampling basis, and acceptance limit. If a measurement uncertainty or reporting threshold materially affects release decisions, require it to be reported.
Warning signs in an SWCNT purity specification
Several patterns justify deeper review before qualification. These include a single purity percentage with no method; Raman data presented as proof of low metal content; ash values without a TGA method; elemental results that omit known catalyst constituents; characterization charts with no lot identification; and claims based on “typical” values when the application requires controlled limits.
Another warning sign is an unusually broad claim that combines several properties into one number, such as “99% pure semiconducting SWCNTs.” This may refer to total nanotube carbon, electronic-type enrichment, or low residual metal content, each of which requires different analytical evidence. The supplier should separate those claims and identify the denominator for each calculation.
The most defensible manufacturer specification is not necessarily the longest or the most impressive-looking one. It is the one that makes its analytical boundaries visible: what was measured, how it was measured, what the number excludes, which lots it represents, and how the result is controlled during production. For SWCNT qualification, that level of transparency is more useful than a purity percentage standing alone.
Related News
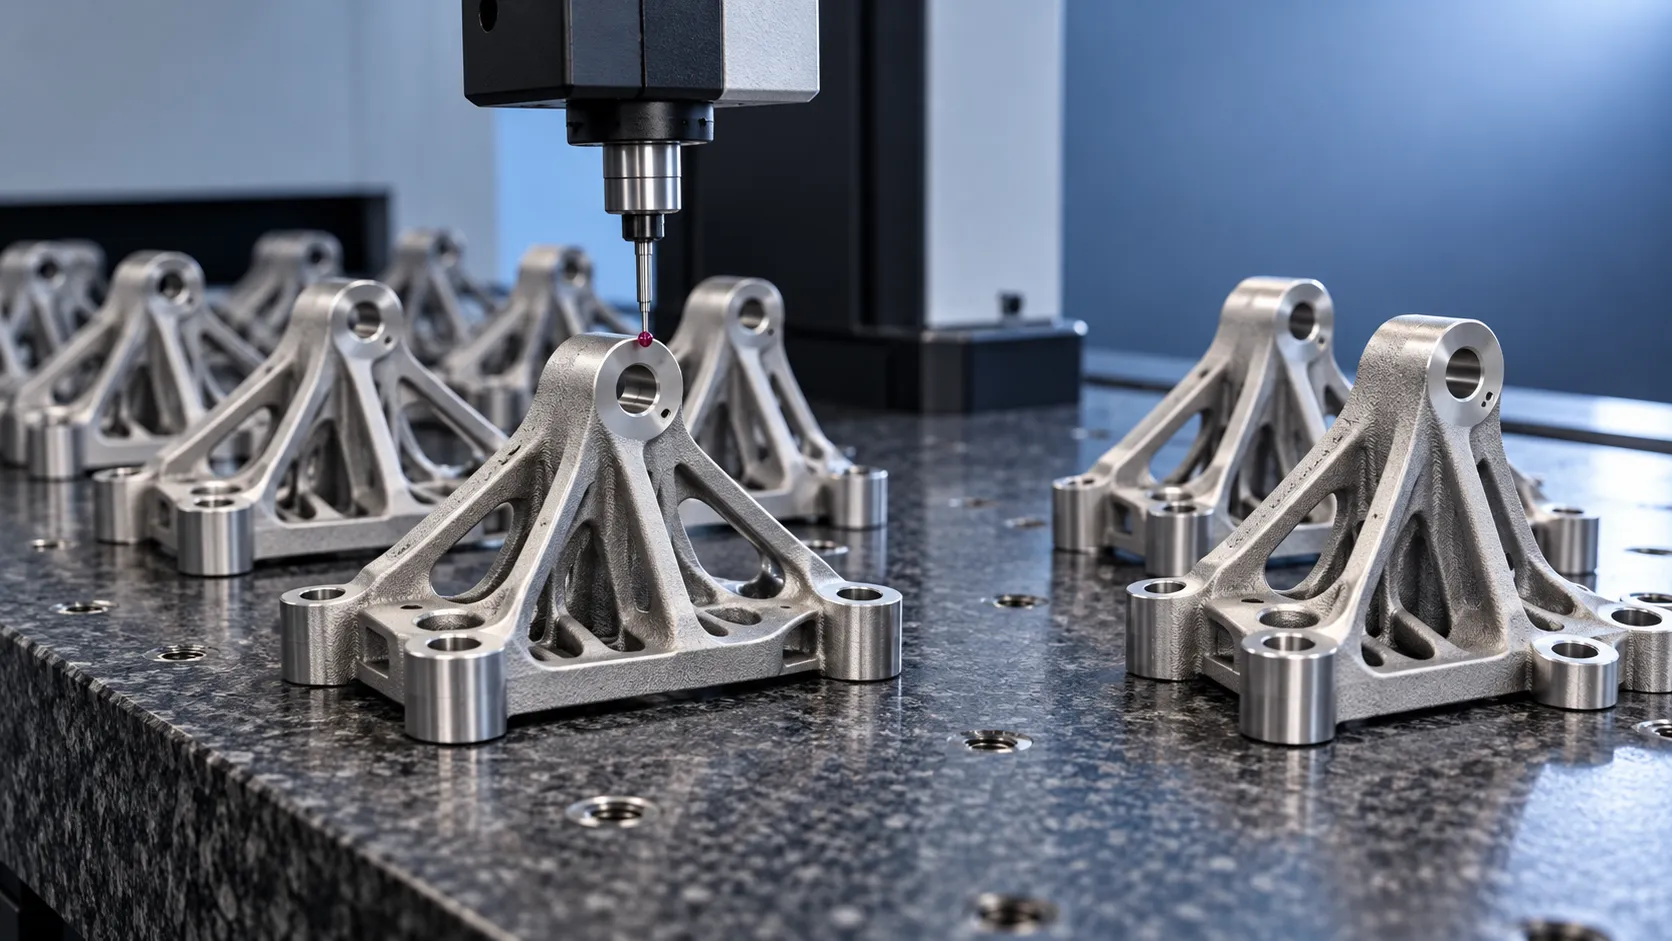
How to verify part consistency before choosing a 3D printing OEM
Choosing a 3D printing OEM? Learn how to verify part consistency with repeat-build trials, validated inspections, and traceability checks before committing to production.

How does a rigid cryogenic transfer line handle thermal contraction?
Learn how a rigid cryogenic transfer line manages thermal contraction with bends, bellows, and guided supports. Discover key design checks for safe, reliable cryogenic performance.
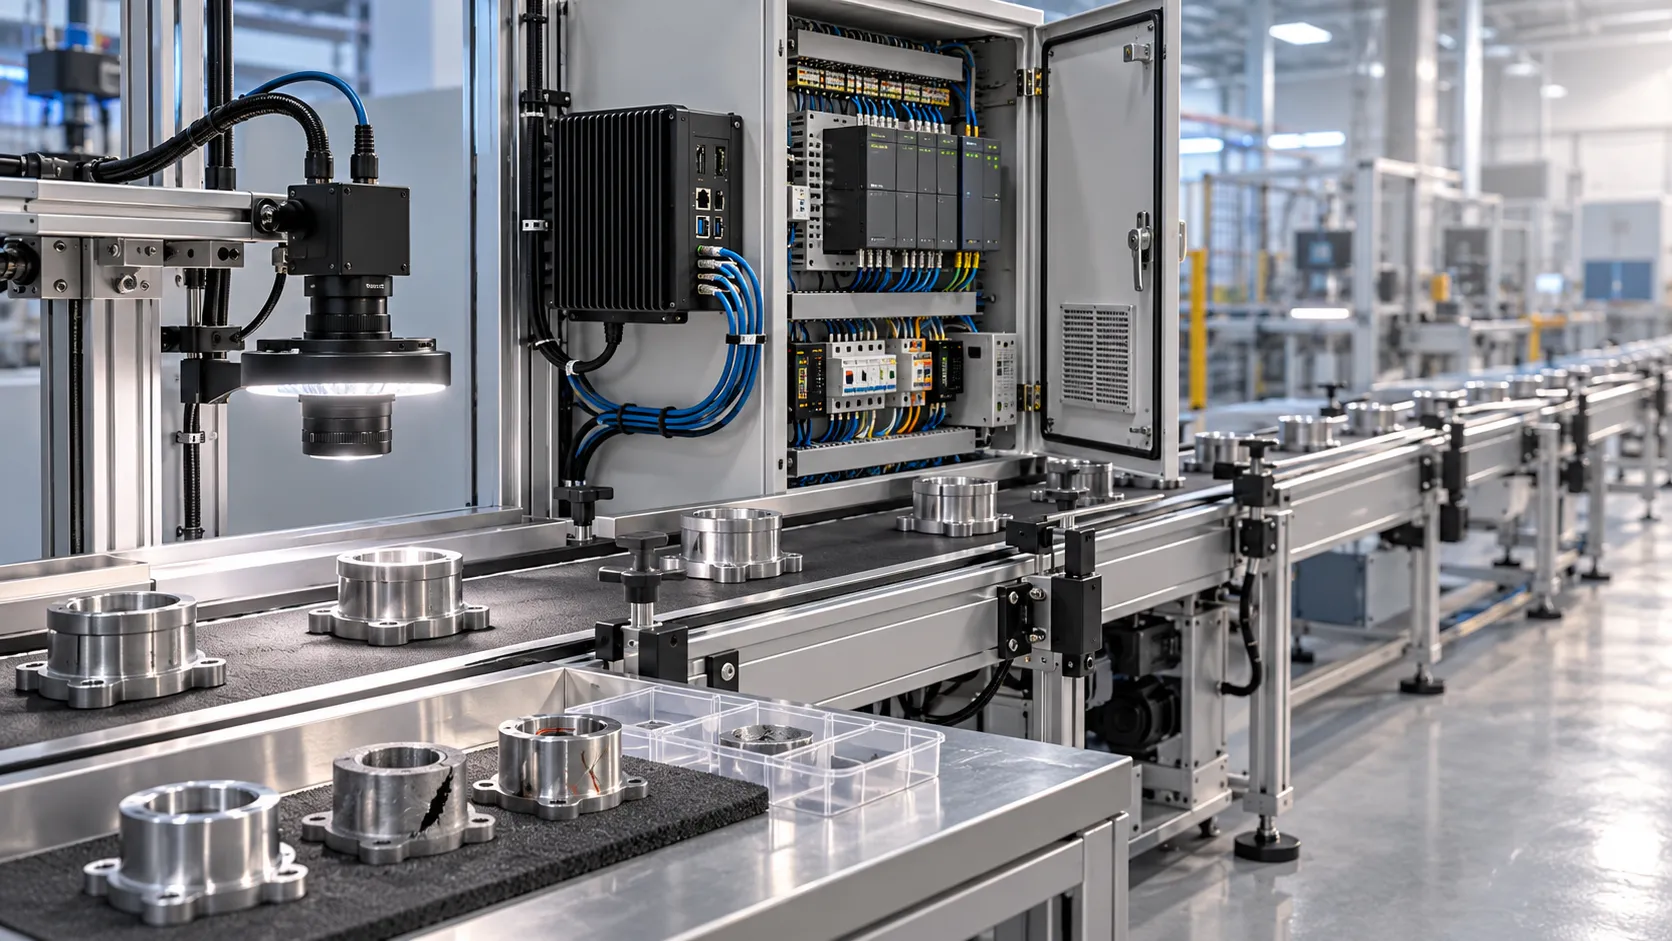
How much does edge vision deployment cost beyond the hardware?
Understand edge vision deployment cost beyond hardware, from data and integration to security and support. Uncover hidden expenses and build a smarter lifecycle budget before you scale.
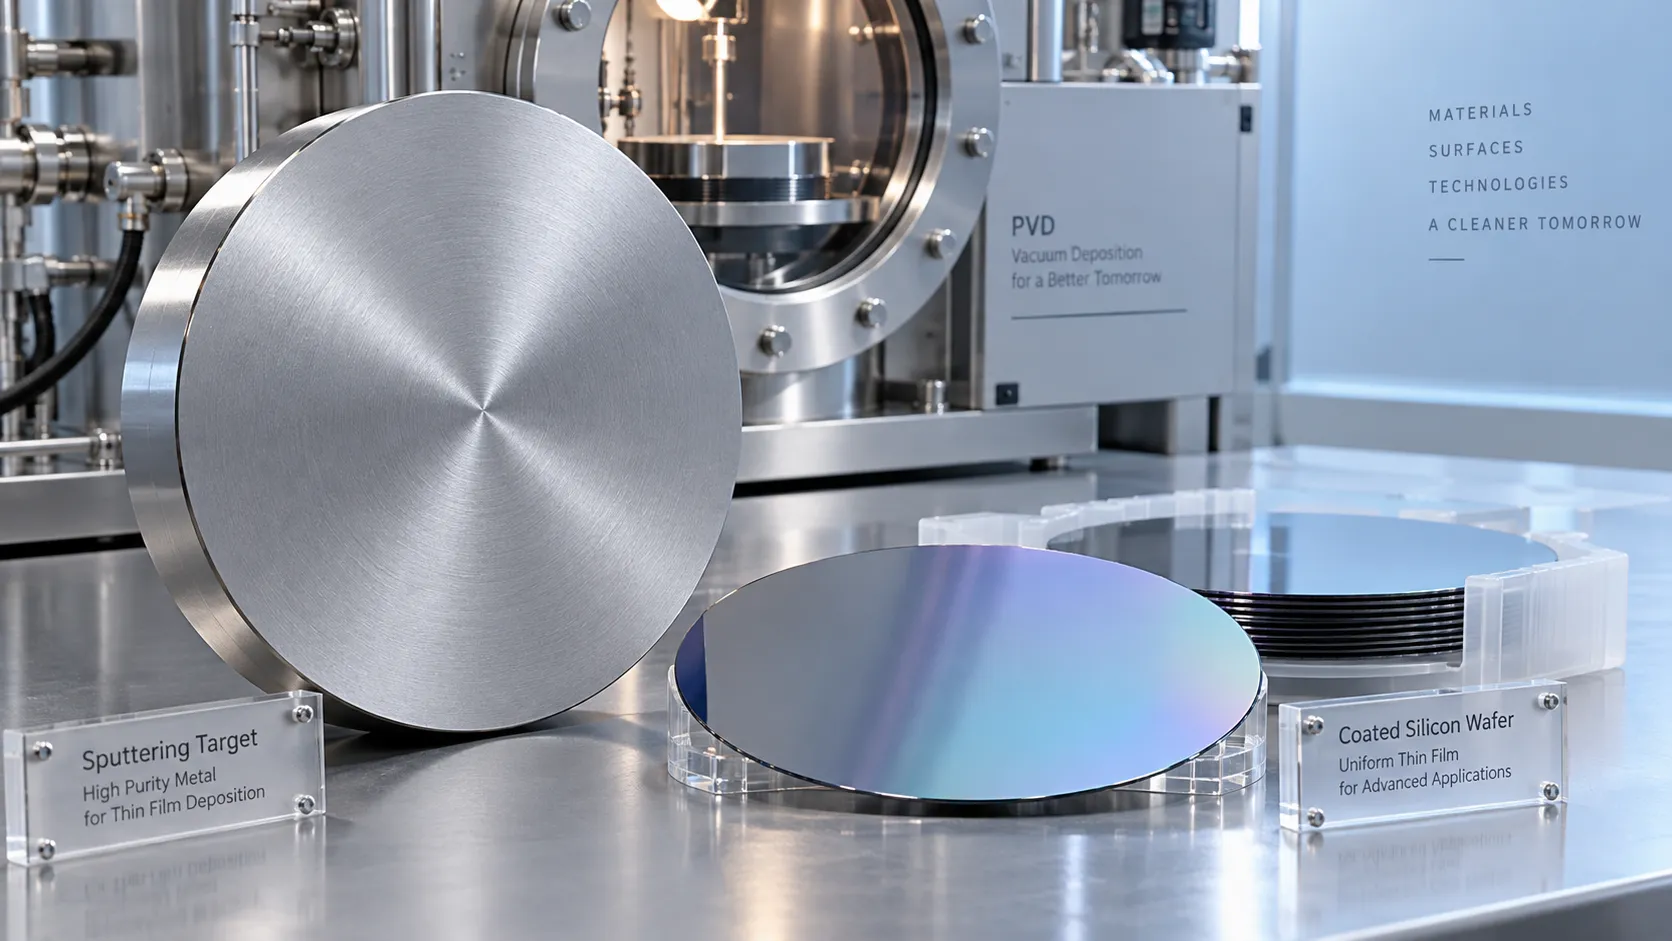
How does the purity of sputtering targets affect thin-film quality?
Discover how sputtering targets affect thin-film quality. Learn to assess purity, identify harmful impurities, and choose specifications that improve coating performance.

How high power laser cladding systems control substrate dilution
Discover how high power laser cladding systems control substrate dilution through beam shaping, material feed, and thermal management to deliver reliable bonds and coating performance.

How to check HS codes for customs compliance in international logistics
Strengthen international logistics customs compliance: learn how to verify HS codes, check official tariffs, and document classifications to reduce costly shipment delays.
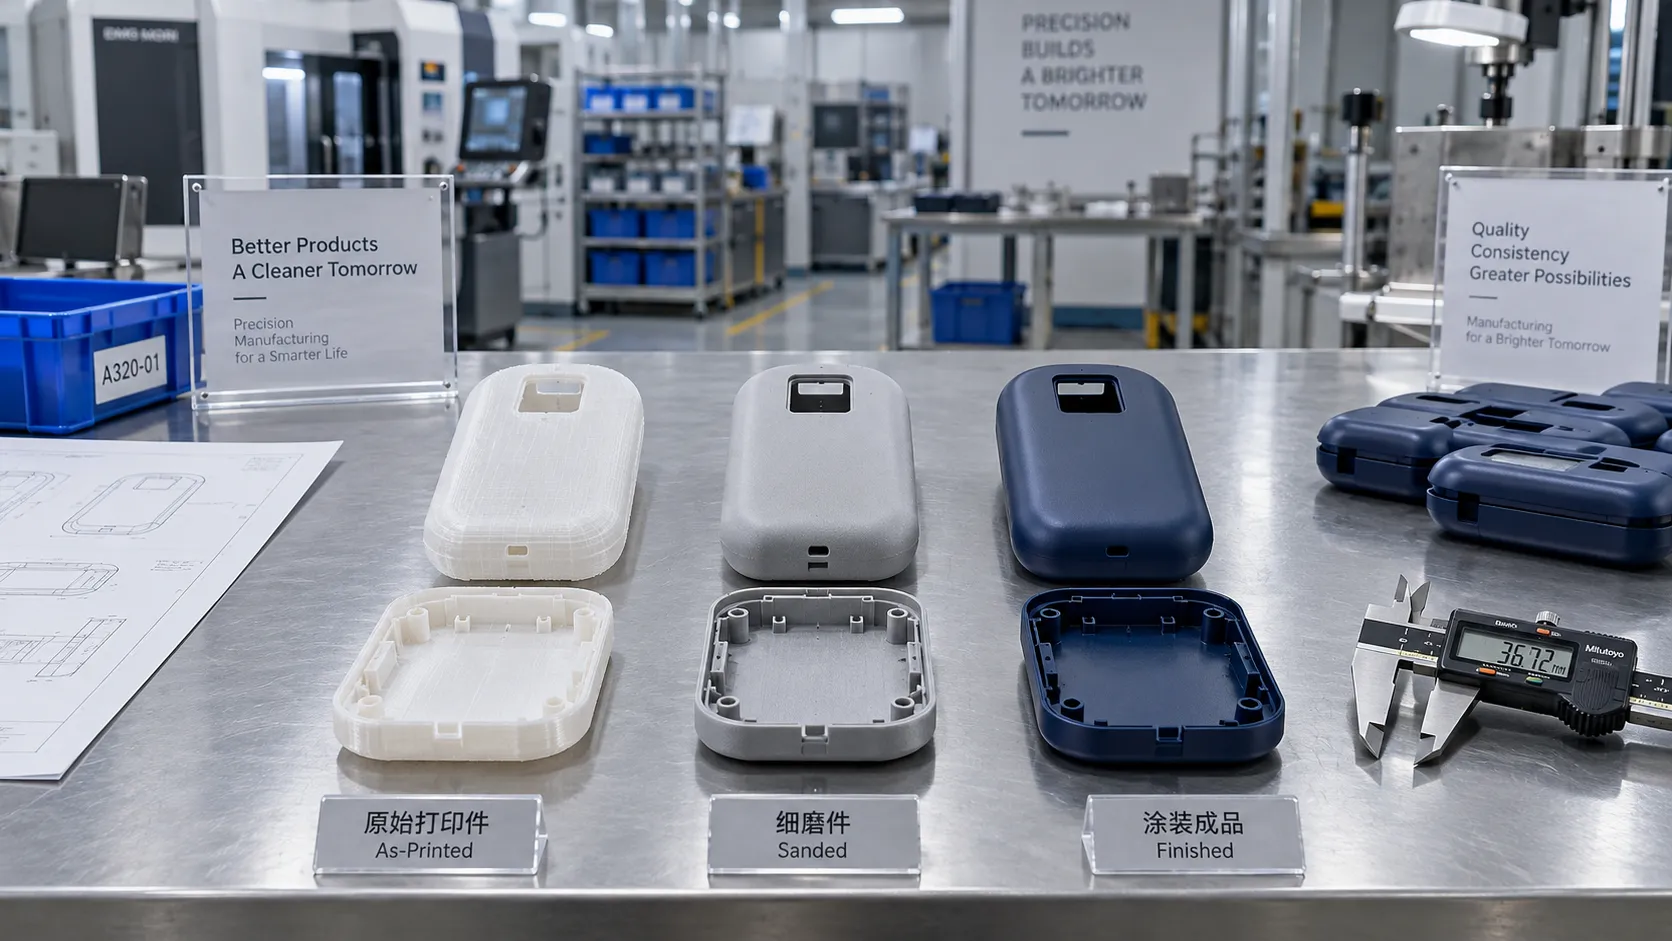
Choosing a 3D Printing Service for Consumer Products: Finish, Fit, and Cost
Compare 3d printing consumer good services by finish, fit, materials, and total cost. Learn how to choose a reliable supplier and avoid costly defects before ordering.
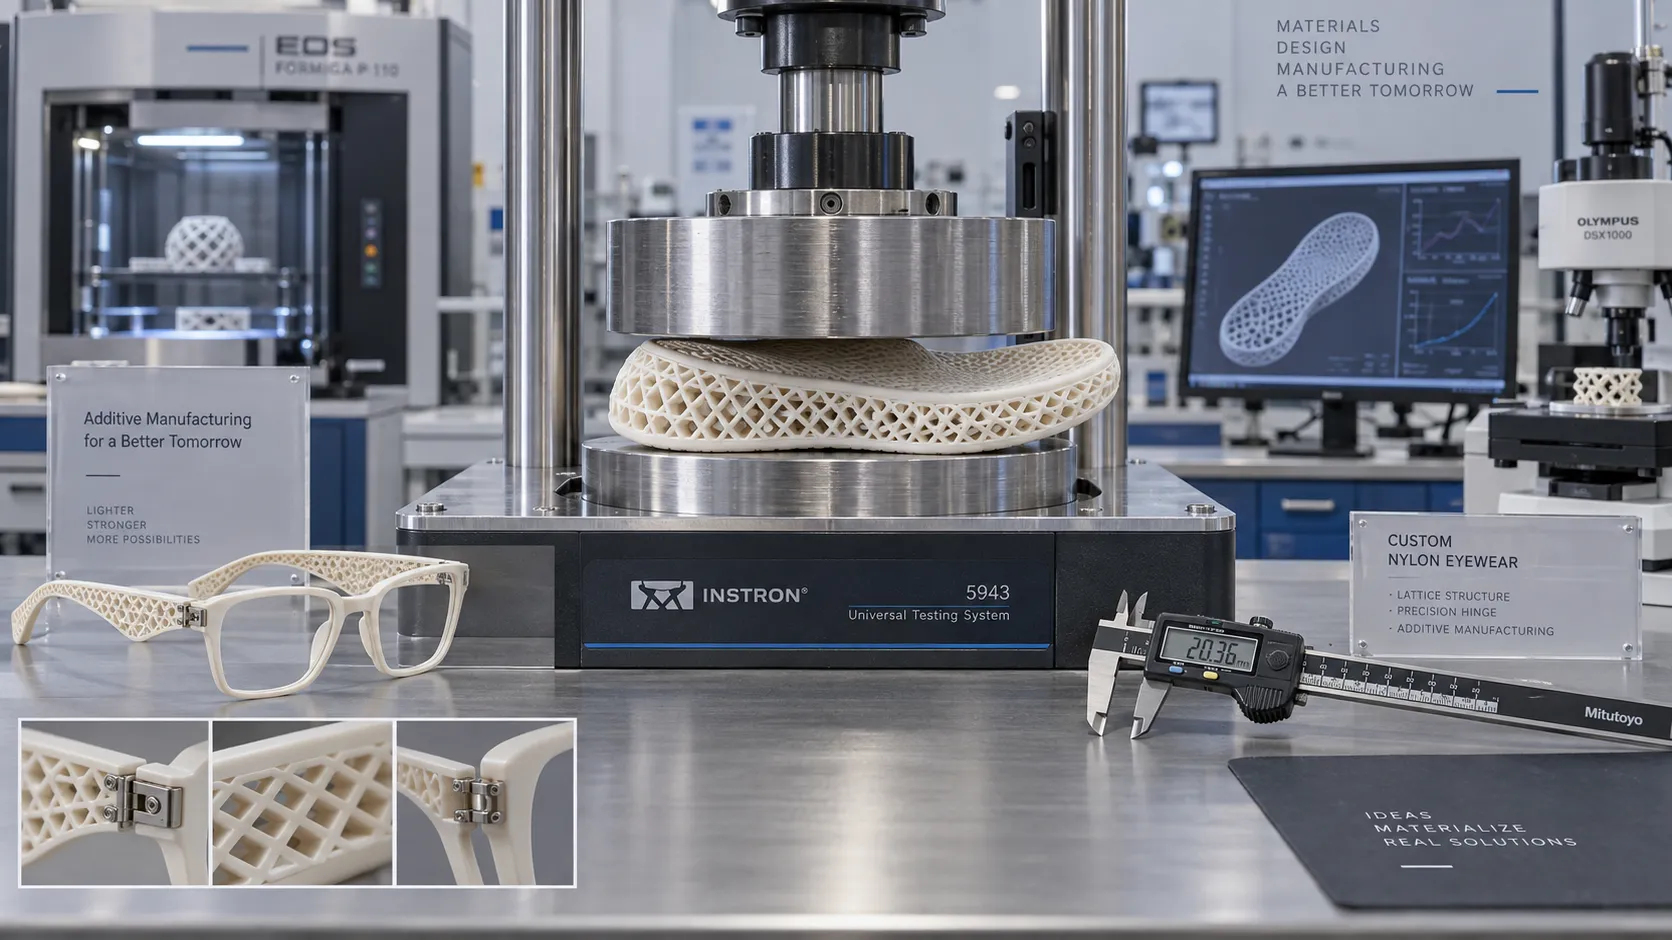
Which Consumer Goods Can Be 3D Printed, and What Are the Practical Limits?
Explore 3d printing consumer goods, from custom eyewear to replacement parts. Discover practical limits on materials, safety, and costs to make smarter production decisions.
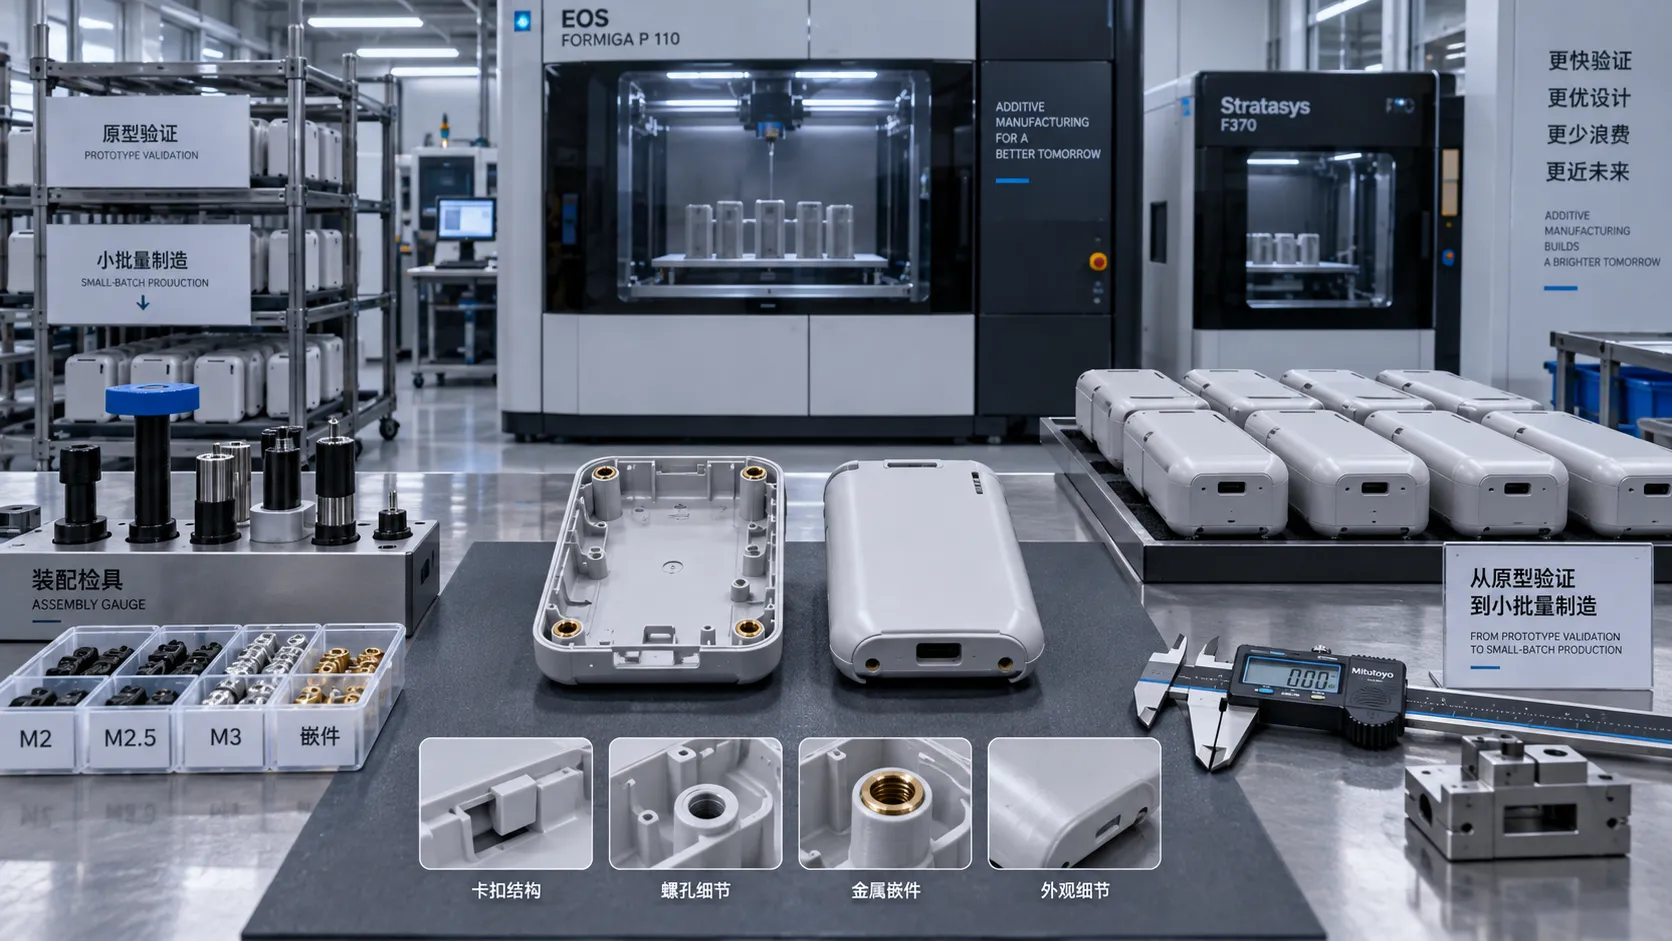
From Prototype to Small Batch: Applying 3D Printing to Consumer Goods
Explore 3d printing in consumer goods: learn how to move from prototype to small-batch production with practical guidance on materials, quality validation, and cost control.
Related News
- 00
0000-00
How to verify part consistency before choosing a 3D printing OEM - 00
0000-00
How does a rigid cryogenic transfer line handle thermal contraction? - 00
0000-00
How much does edge vision deployment cost beyond the hardware? - 00
0000-00
How does the purity of sputtering targets affect thin-film quality? - 00
0000-00
How high power laser cladding systems control substrate dilution
Dr. Elena Carbon
Weekly Insights
Stay ahead with our curated technology reports delivered every Monday.