
3D Scanning Mesh Resolution Benchmarks Explained


For technical evaluators comparing scan quality across systems, understanding 3d scanning mesh resolution benchmarks is essential to making defensible decisions.
This topic now matters more because industrial inspection, reverse engineering, and digital twin programs demand measurable, repeatable scan outputs.
Raw point counts no longer prove capability alone. Mesh density, edge retention, noise behavior, and downstream usability now define meaningful benchmark results.
Well-structured 3d scanning mesh resolution benchmarks help convert vendor claims into engineering evidence aligned with ISO-style validation and application risk.
Why benchmark expectations are changing across industrial scanning
The market has shifted from simple geometry capture toward application-specific fidelity targets.
A mesh that looks detailed on screen may still fail inspection, simulation, tooling reconstruction, or archival requirements.
As a result, 3d scanning mesh resolution benchmarks increasingly compare usable resolution, not advertised resolution.
This change is visible in aerospace parts, molded components, castings, electronics housings, medical models, and heritage assets.
Across these sectors, benchmark discussions now include feature detectability, local surface roughness, and meshing stability under varied lighting and materials.
The strongest trend signals behind 3d scanning mesh resolution benchmarks
Several technical signals explain why 3d scanning mesh resolution benchmarks have become more disciplined and more application-driven.
- Higher demand for traceable inspection data in regulated manufacturing.
- Broader use of digital twins that require stable geometry across updates.
- Growth of AI-based defect analysis that is sensitive to mesh noise.
- More mixed-material parts, causing variable reflectivity and acquisition difficulty.
- Increased integration with CAD, metrology, finite element analysis, and automation software.
These signals push teams to ask a better question: how much of the mesh is truly trustworthy at a given feature scale?
What benchmark data actually measures, beyond simple mesh density
Many misunderstand 3d scanning mesh resolution benchmarks as a comparison of triangle counts alone.
In practice, benchmark quality emerges from multiple interacting variables.
Key benchmark dimensions
A rigorous benchmark should include at least these dimensions. Otherwise, two scanners can seem comparable while behaving very differently in production.
Why the same scanner can score differently in different benchmark scenarios
Context strongly changes 3d scanning mesh resolution benchmarks.
A polished metal blade, matte polymer housing, dark composite panel, and translucent part challenge sensors in different ways.
Benchmark outcomes also shift with stand-off distance, exposure settings, alignment strategy, and mesh post-processing.
This is why useful benchmarking compares performance under controlled but realistic use cases.
Common variables that alter outcomes
- Material reflectivity and translucency
- Part size and curvature complexity
- Target feature size versus nominal resolution
- Environmental vibration and temperature drift
- Operator workflow and data-cleaning assumptions
Without documenting these factors, benchmark claims remain hard to compare and easy to misinterpret.
How application upgrades are reshaping benchmark priorities
The rise of hybrid workflows is changing what counts as acceptable mesh quality.
In reverse engineering, smooth but inaccurate meshes can distort CAD reconstruction.
In dimensional inspection, dense meshes with unstable noise can produce false deviations.
In additive manufacturing repair, incomplete edges can compromise toolpath generation and fit validation.
Accordingly, 3d scanning mesh resolution benchmarks now favor task-linked evidence rather than generic visual quality.
Application-specific benchmark focus
The most important questions to ask when reviewing 3d scanning mesh resolution benchmarks
Not every benchmark dataset is decision-grade. Strong evaluation requires structured scrutiny.
- Was the reference artifact calibrated and independently verified?
- Were mesh settings standardized across compared systems?
- Did the test report separate acquisition quality from software smoothing?
- Were fine features measured by visibility, accuracy, or both?
- Did the benchmark include difficult materials and realistic geometry?
- Was repeatability tested across multiple scans and operators?
These questions reveal whether 3d scanning mesh resolution benchmarks support real deployment or only marketing comparison.
What organizations should monitor as benchmark standards mature
Benchmark practice is moving toward stronger standardization, especially where quality systems, export controls, and international compliance intersect.
Institutions such as G-AIT add value by aligning benchmark interpretation with cross-sector engineering evidence and recognized standards frameworks.
This matters because a benchmark that satisfies one internal team may still fail supplier qualification or cross-border technical review.
Priority monitoring points
- Traceability between scan settings, mesh outputs, and validation reports
- Alignment with ISO, ASTM, IEEE, or sector-specific test expectations
- Software updates that change default meshing behavior
- Interoperability with inspection, CAD, and simulation platforms
- Data governance for archived meshes used in regulated workflows
A practical response framework for comparing benchmark claims
A defensible response starts with narrowing benchmarks to the intended task and risk level.
This framework turns 3d scanning mesh resolution benchmarks into a useful decision tool instead of a static specification sheet.
Where the next benchmark advantage is likely to emerge
The next differentiator will likely be benchmark transparency, not just higher nominal resolution.
Systems that document mesh behavior across materials, feature scales, and software states will create stronger technical trust.
As industrial workflows become more connected, 3d scanning mesh resolution benchmarks will increasingly be judged by downstream reliability.
That includes whether the mesh supports inspection, design reuse, automation, and compliance without hidden rework.
To move forward effectively, review benchmark reports against your target feature scale, material complexity, and validation needs.
Prioritize evidence showing repeatability, edge fidelity, and honest noise reporting.
When assessed this way, 3d scanning mesh resolution benchmarks become a reliable foundation for technical comparison, project planning, and long-term industrial integration.
Related News
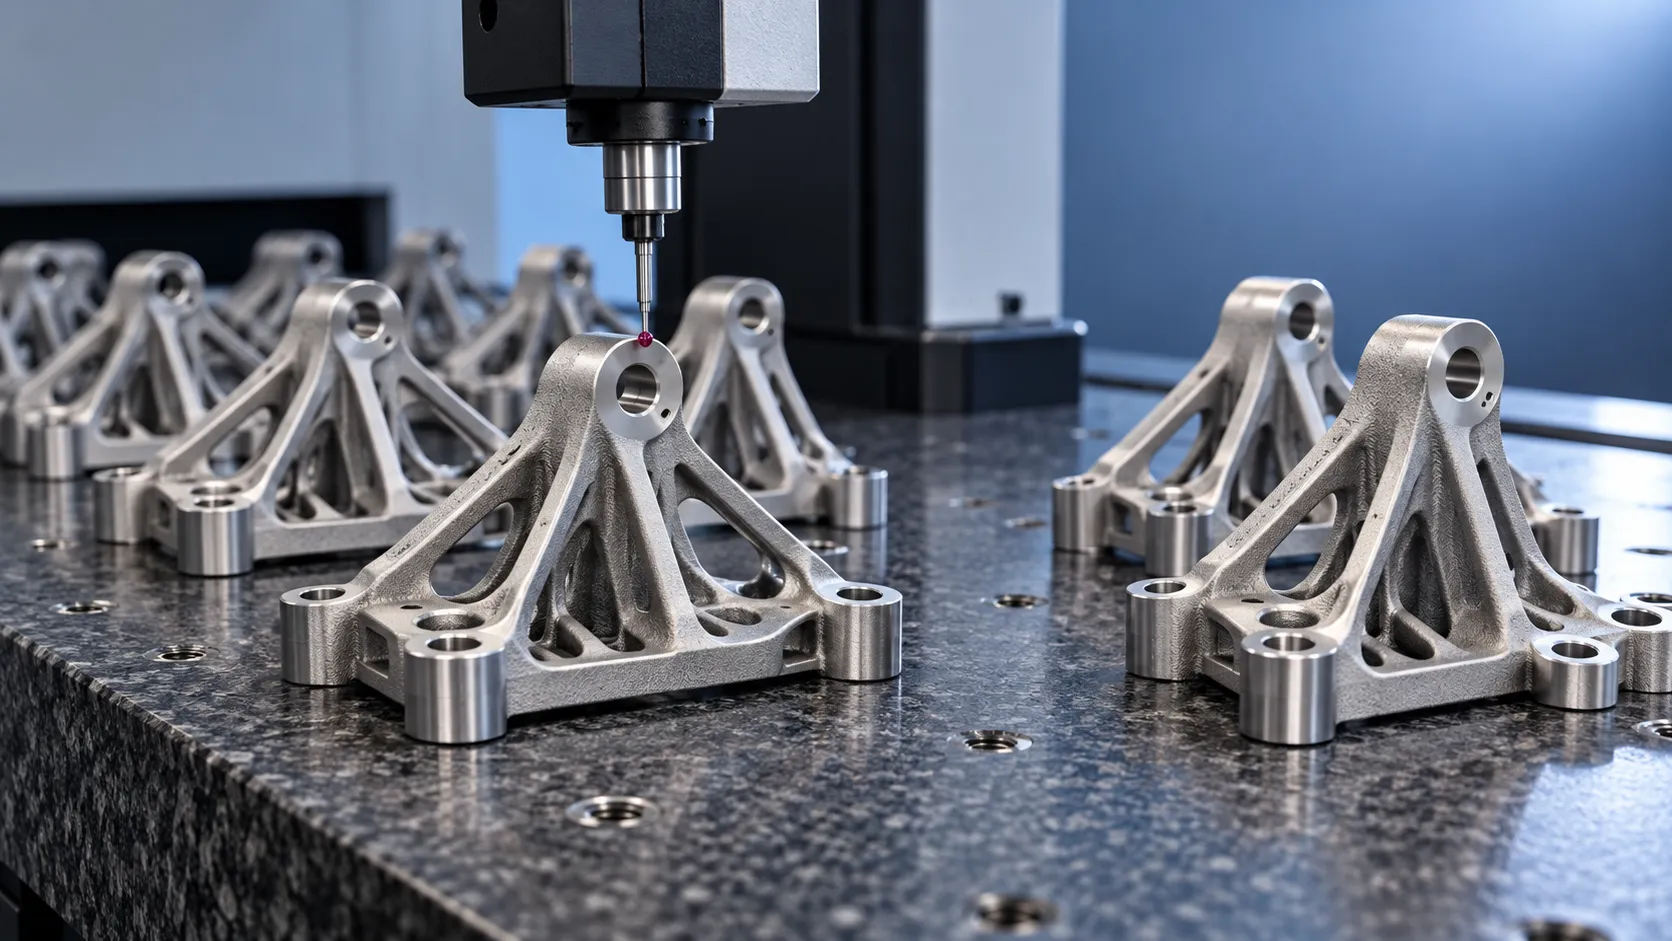
How to verify part consistency before choosing a 3D printing OEM
Choosing a 3D printing OEM? Learn how to verify part consistency with repeat-build trials, validated inspections, and traceability checks before committing to production.
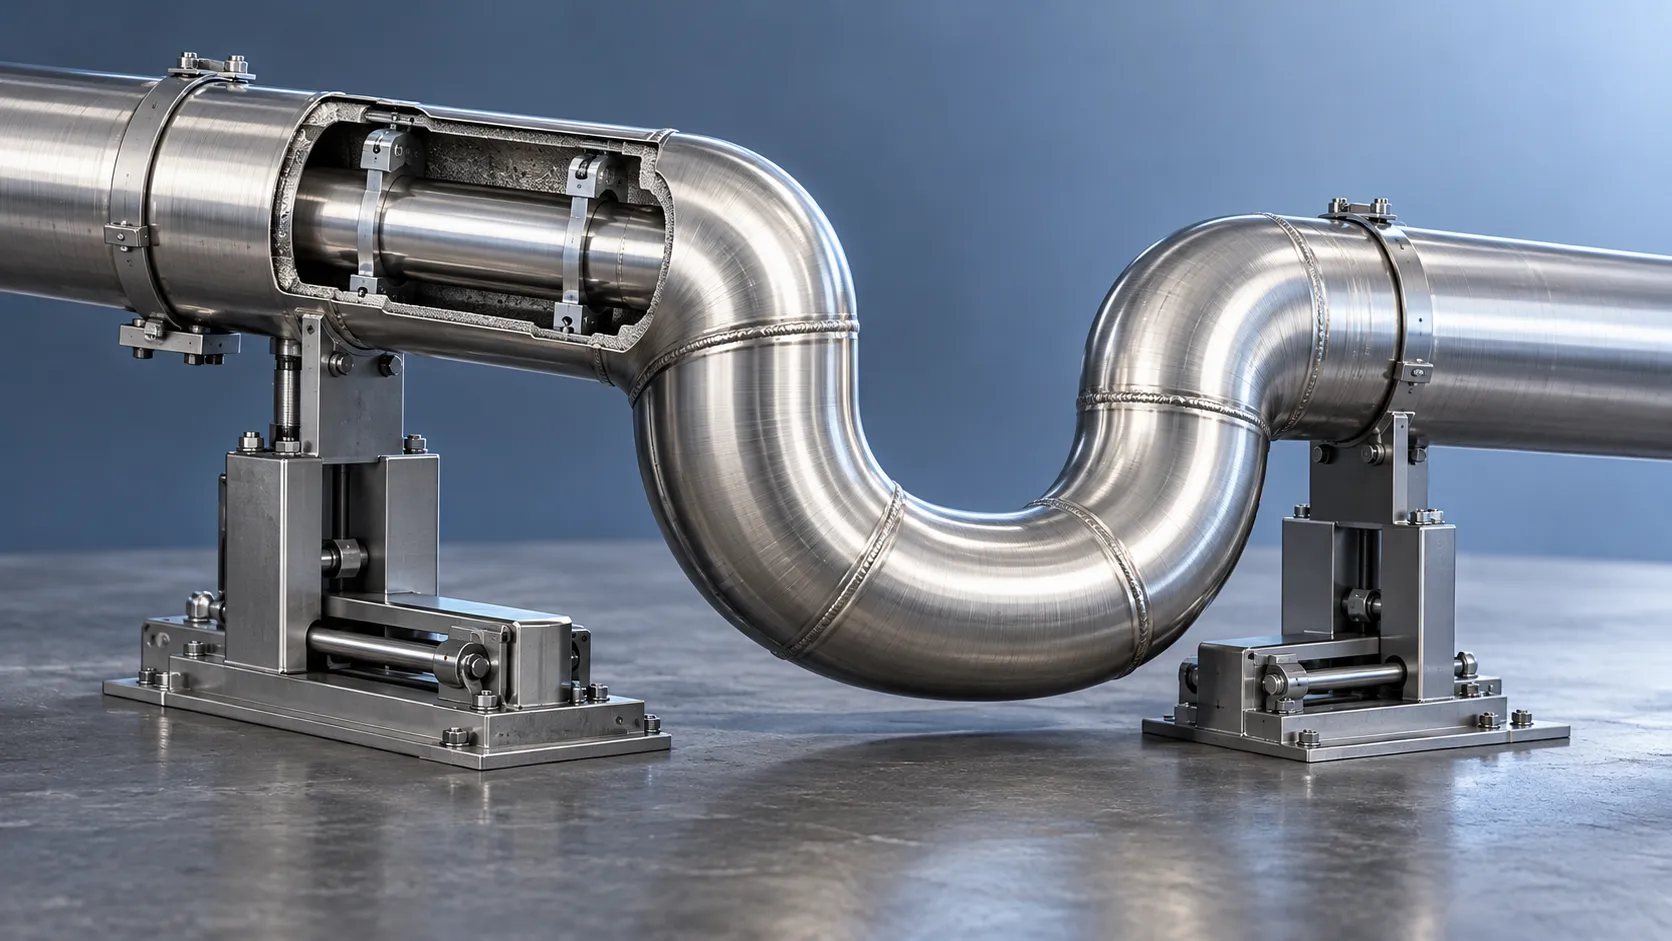
How does a rigid cryogenic transfer line handle thermal contraction?
Learn how a rigid cryogenic transfer line manages thermal contraction with bends, bellows, and guided supports. Discover key design checks for safe, reliable cryogenic performance.

How much does edge vision deployment cost beyond the hardware?
Understand edge vision deployment cost beyond hardware, from data and integration to security and support. Uncover hidden expenses and build a smarter lifecycle budget before you scale.
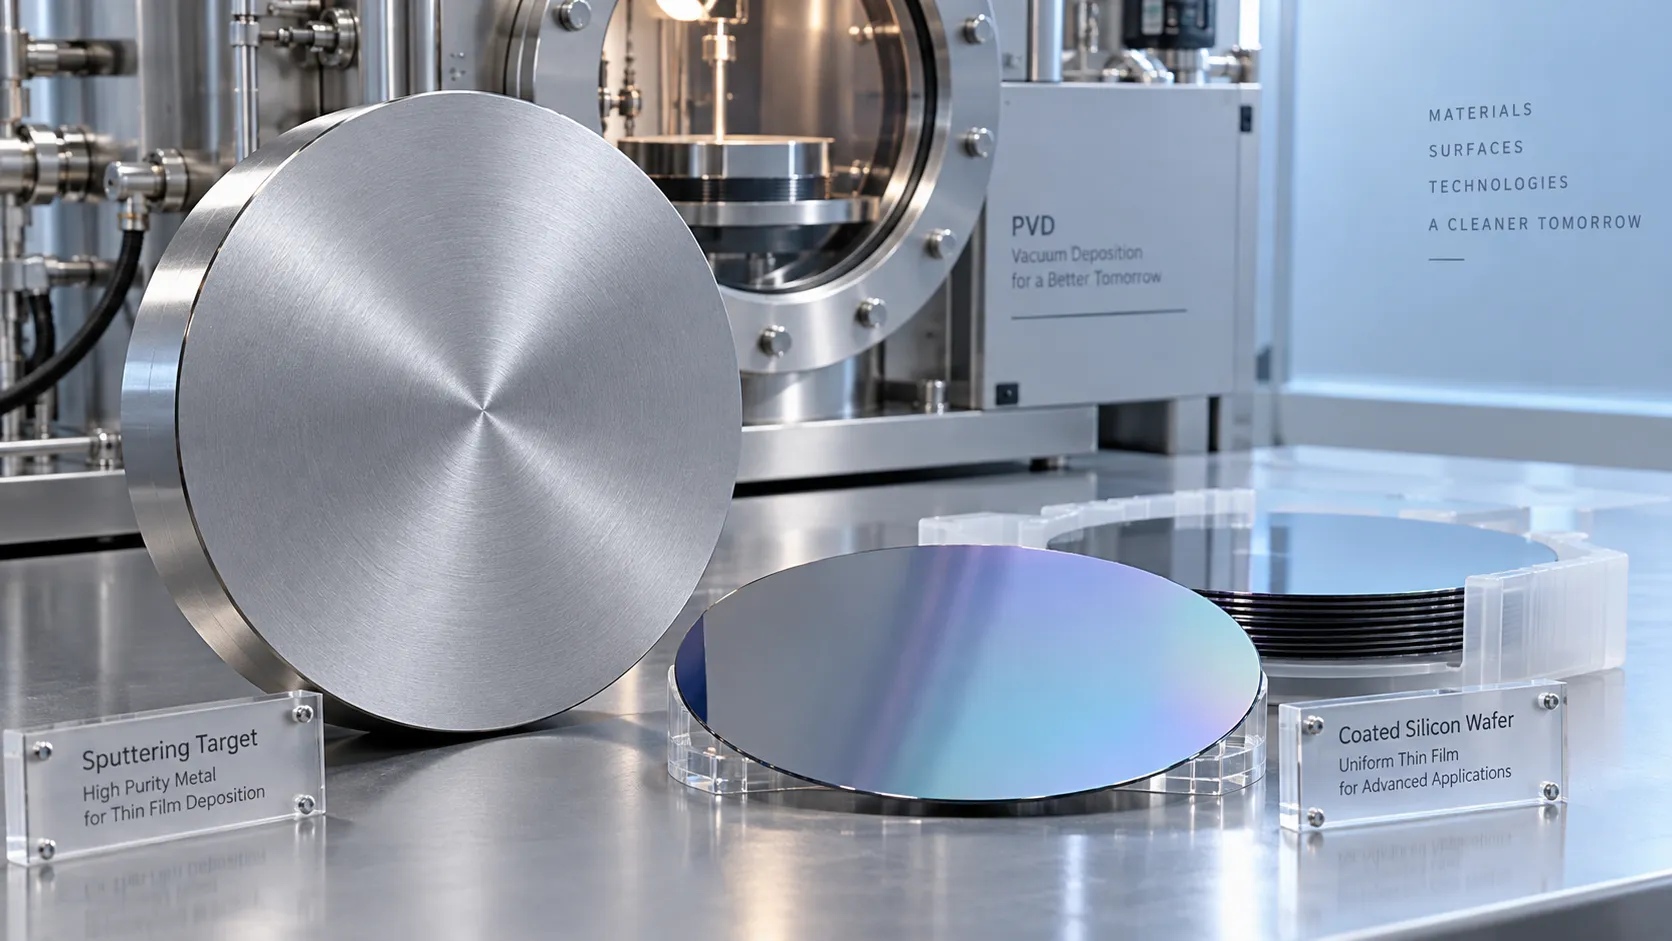
How does the purity of sputtering targets affect thin-film quality?
Discover how sputtering targets affect thin-film quality. Learn to assess purity, identify harmful impurities, and choose specifications that improve coating performance.

How high power laser cladding systems control substrate dilution
Discover how high power laser cladding systems control substrate dilution through beam shaping, material feed, and thermal management to deliver reliable bonds and coating performance.

How to check HS codes for customs compliance in international logistics
Strengthen international logistics customs compliance: learn how to verify HS codes, check official tariffs, and document classifications to reduce costly shipment delays.
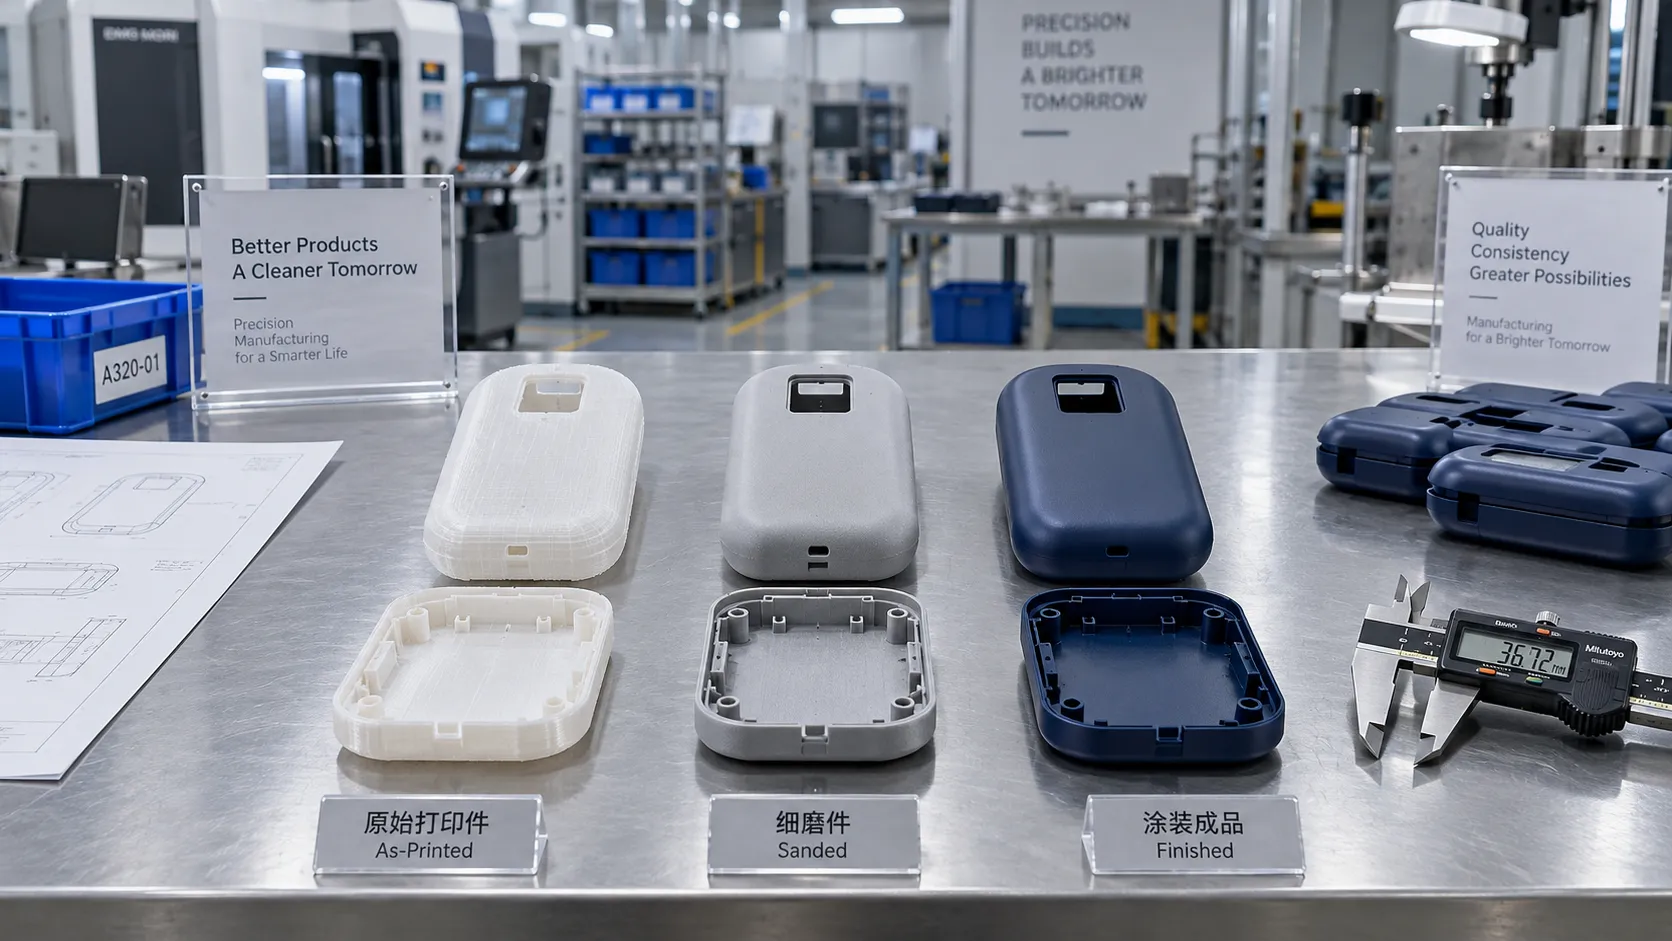
Choosing a 3D Printing Service for Consumer Products: Finish, Fit, and Cost
Compare 3d printing consumer good services by finish, fit, materials, and total cost. Learn how to choose a reliable supplier and avoid costly defects before ordering.

Which Consumer Goods Can Be 3D Printed, and What Are the Practical Limits?
Explore 3d printing consumer goods, from custom eyewear to replacement parts. Discover practical limits on materials, safety, and costs to make smarter production decisions.

From Prototype to Small Batch: Applying 3D Printing to Consumer Goods
Explore 3d printing in consumer goods: learn how to move from prototype to small-batch production with practical guidance on materials, quality validation, and cost control.
Related News
- 00
0000-00
How to verify part consistency before choosing a 3D printing OEM - 00
0000-00
How does a rigid cryogenic transfer line handle thermal contraction? - 00
0000-00
How much does edge vision deployment cost beyond the hardware? - 00
0000-00
How does the purity of sputtering targets affect thin-film quality? - 00
0000-00
How high power laser cladding systems control substrate dilution
Dr. Victor Gear
Weekly Insights
Stay ahead with our curated technology reports delivered every Monday.