
How BET analysis helps compare surface area in nanomaterials

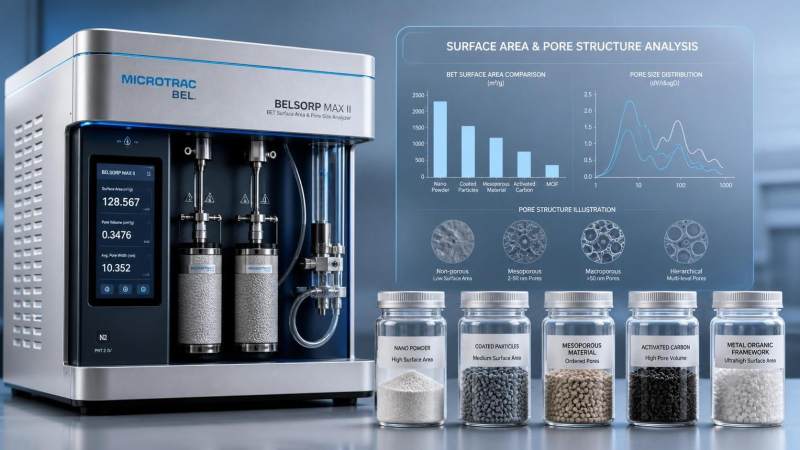
For technical evaluators comparing powders, coatings, and advanced particles, nanomaterial BET analysis offers a reliable way to quantify surface area and reveal performance differences that are not visible through particle size alone. By linking adsorption data to porosity, dispersion behavior, and process consistency, it helps teams make more defensible material selections in R&D, procurement, and quality benchmarking.
That practical value explains why BET surface area data appears so often in nanomaterial datasheets, qualification reports, and customer specifications. But the number itself is easy to misuse. A higher specific surface area does not automatically mean a better nanomaterial, and two materials with similar BET results can still behave very differently in production. The real value of nanomaterial BET analysis is not in generating a single headline figure. It is in making technically sound comparisons when morphology, agglomeration, pore structure, and processing history are all influencing performance at once.
Why surface area matters more than nominal particle size
In nanomaterials, nominal particle size is usually the first figure that buyers or engineers look at. It is also one of the least sufficient for decision-making. A powder specified as 20 nm may arrive as hard agglomerates. A coating precursor with narrow primary particle size may still show poor wetting or inconsistent catalytic behavior. A graphene-derived material may have excellent lateral dimensions on paper while offering limited accessible surface in practice.
Surface area often tracks the part of the material that is actually available for interaction. That interaction may involve adsorption, catalytic reaction, electrochemical charge transfer, binder contact, moisture uptake, sintering response, or dispersion in liquid systems. BET analysis is valuable because it measures the accessible surface through gas adsorption behavior rather than assuming that all particles are discrete, ideal spheres.
For technical evaluation, this helps answer questions that particle size analysis alone cannot resolve:
- Are two powders with similar D50 values actually offering comparable active surface?
- Has a drying, calcination, milling, or coating process reduced accessible area?
- Is a supplier’s claimed nano-scale morphology reflected in measurable surface characteristics?
- Does batch-to-batch variation suggest porosity changes or agglomeration drift?
In many industrial settings, these are the questions that affect yield, product performance, and qualification risk.
What BET analysis actually measures
BET refers to the Brunauer-Emmett-Teller theory, which is used to calculate specific surface area from physical adsorption isotherm data, most commonly using nitrogen adsorption at cryogenic temperature. The result is usually reported in m²/g.
The key point is that BET does not directly “see” particle size. It infers the total accessible surface from how much gas adsorbs onto the material under controlled conditions. This matters because accessible surface is shaped not only by primary particle dimensions, but also by:
- particle aggregation and agglomeration;
- open porosity and pore size distribution;
- surface roughness;
- thermal treatment history;
- residual moisture or organics;
- degree of exfoliation in layered materials.
For nanomaterials, that makes BET particularly useful as a comparative tool. It is often less useful as a stand-alone descriptor. A technical evaluator should read BET values as one part of a surface-structure profile rather than as a universal performance score.
Where BET comparison is especially informative
BET analysis becomes highly informative when the material’s function depends on interfacial phenomena.
In catalysts and catalyst supports, surface area may influence active site availability, metal dispersion, and reactant access. In battery materials, it can affect electrolyte contact, side reaction tendency, and rate behavior. In conductive additives and carbon nanomaterials, it often correlates with network formation, absorption of binders or resins, and impurity sensitivity. In ceramic and powder metallurgy feedstocks, it can influence sintering kinetics, flow behavior, and moisture pickup. In coatings and functional fillers, it can affect rheology, wetting demand, and dispersion energy requirements.
For these applications, nanomaterial BET analysis helps evaluators identify whether two materials that look similar in particle size reports are likely to behave differently in process. That is often the hidden issue in supplier comparisons: one material delivers better reactivity or dispersion not because the chemistry is different, but because the accessible surface and porosity profile are different.
Why BET values should not be interpreted in isolation
A common mistake in procurement and technical benchmarking is to rank samples by BET value alone. That shortcut can be misleading for several reasons.
One reason is that surface area may rise because of porosity that is not useful in the target application. Another is that very high area can increase reactivity, but also create handling challenges such as moisture sensitivity, dusting, poor flow, or excess binder demand. In battery and catalysis systems, higher area can improve kinetics while also increasing unwanted side reactions. In polymer compounding, more area may improve reinforcement potential but make dispersion significantly harder.
There is also a difference between external surface area and internal pore surface. Depending on the application, one may matter more than the other. If a formulation cannot access narrow pores because of liquid viscosity, molecular size, or residence time, the full BET surface may not translate into usable performance.
For that reason, BET comparison works best when combined with at least some of the following:
- particle size distribution;
- SEM or TEM morphology review;
- pore volume and pore size data;
- true density or tapped density;
- loss on drying or volatile content;
- surface chemistry analysis such as XPS or FTIR where relevant;
- application-level dispersion, rheology, or electrochemical testing.
Without that context, the BET number may be technically correct but commercially overinterpreted.
How sample preparation can change the result
When technical teams see unexpected variation in BET data, the cause is often not the instrument but the sample preparation protocol. Degassing conditions are especially critical. If degassing is too mild, residual moisture or adsorbed contaminants may remain and distort the isotherm. If it is too aggressive, delicate nanomaterials may undergo structural change, pore collapse, oxidation state change, or removal of surface species that are part of the actual use condition.
This is one reason supplier-to-supplier BET comparisons can be problematic. Even when both parties report m²/g values, the underlying preparation parameters may differ in temperature, vacuum level, duration, and gas selection. For hygroscopic materials, surface-treated powders, porous carbons, or soft agglomerated oxides, these differences can materially shift the result.
Technical evaluators should therefore ask for more than a certificate value. At minimum, the comparison record should capture:
- adsorbate gas used;
- degassing temperature and time;
- sample mass;
- BET fitting range or pressure range;
- whether replicate testing was performed;
- whether the material was tested as-received or after conditioning.
If those details are missing, the value may still be useful for internal trending, but it is weaker for supplier qualification or contractual acceptance.
Standards matter, but consistency matters more
BET surface area measurement is supported by established international standardization practice, including ISO 9277 for the determination of the specific surface area of solids by gas adsorption using the BET method. In many industrial environments, alignment with ISO 9277 helps improve comparability and documentation discipline.
Even so, standard conformance alone does not eliminate interpretation risk. ISO-based measurement still requires technically appropriate choices around pretreatment and data fitting. For nanomaterials with unusual adsorption behavior, microporosity, or fragile structure, method suitability deserves review rather than assumption.
In quality benchmarking, the most dependable approach is often a controlled internal method built on recognized standards and applied consistently across all candidate materials. That creates a stronger basis for comparison than mixing nominally standard-compliant values from multiple external sources with unknown preparation history.
Using BET analysis to compare powders, coatings, and advanced particles
The comparison logic differs by material form.
For free-flowing powders, BET analysis is often used to check whether a nominally equivalent material has similar accessible area after synthesis, calcination, or milling. A drop in surface area may indicate growth, densification, or pore loss. A rise may indicate finer structure, increased porosity, or higher agglomerate break-up.
For nanoparticle dispersions converted into dried test samples, interpretation becomes more delicate. Drying can alter agglomeration state, so BET may not perfectly reflect the original liquid-dispersion behavior. Even then, it can still be useful for comparing solids recovered under a controlled protocol.
For coatings, thin films, or supported nanostructures, BET is less universally straightforward. The measurable surface may depend on substrate contribution, coating mass, and whether the architecture provides sufficient adsorption access. In such cases, BET can support comparison, but often alongside cross-sectional imaging, loading data, and functional testing rather than as a primary standalone metric.
For porous carbons, graphene-derived materials, silica, alumina, and catalytic supports, BET is often central to specification review. But the technical evaluator still needs to distinguish between materials whose high area is dominated by microporosity and those with more accessible mesoporosity. That distinction may change impregnation behavior, transport kinetics, or formulation compatibility.
What BET analysis can reveal about process consistency
One of the strongest uses of nanomaterial BET analysis is not product marketing comparison but process control. Surface area often responds to production drift earlier than bulk chemistry does.
Changes in precursor purity, reactor temperature profile, drying endpoint, calcination severity, and post-treatment conditions can all show up in BET data. In a stable process, the BET range tends to form a recognizable fingerprint when paired with pore volume, density, and morphology checks. When the fingerprint shifts, the issue may be structural even before the downstream application fails.
For technical evaluation teams auditing suppliers or onboarding a second source, this is valuable. A supplier that can show statistically controlled BET data across batches usually offers stronger evidence of process maturity than one that supplies only a broad nominal range. The number itself matters less than the reproducibility pattern behind it.
Common interpretation mistakes in nanomaterial benchmarking
Several mistakes appear repeatedly in technical reviews.
The first is comparing BET values from different reports as if they were generated under identical conditions. They often are not.
The second is assuming that higher BET automatically indicates smaller particle size. Porosity and roughness can raise surface area without changing primary particle dimensions in the expected way.
The third is ignoring the role of agglomeration. A material can have high intrinsic area but poor application performance if its structure is difficult to disperse or inaccessible in the real process environment.
The fourth is using BET as proof of nanomaterial status. Surface area may support a nano-related claim, but it is not a formal substitute for morphological characterization or regulatory classification. Depending on jurisdiction and use case, nanomaterial definitions may involve particle number-based criteria, dimensional thresholds, or other parameters 【待核实】.
The fifth is failing to connect surface area to the actual failure mode under investigation. If the application problem is electrical contact resistance, sedimentation, viscosity drift, or low coating adhesion, BET may be relevant, but not always decisive. The right question is whether surface accessibility is one of the mechanisms driving the issue.
How technical evaluators should use BET in material selection
A strong evaluation workflow treats BET as a decision-support metric, not a procurement shortcut.
When screening candidate nanomaterials, BET can quickly eliminate options that are structurally inconsistent with the target application. It can also help explain why materials with similar composition deliver different pilot results. During supplier comparison, it is useful for verifying whether a lower-cost alternative is truly equivalent in accessible surface terms. In quality agreements, it can serve as a monitored parameter if the relationship to end-use performance has been demonstrated.
What matters is linking the BET window to process or product relevance. If a catalyst support performs best within a specific surface area range, that range should be justified by activity, selectivity, and stability data. If a conductive additive becomes too difficult to disperse above a threshold, that threshold should inform incoming quality criteria. If a ceramic powder loses sintering behavior below a certain BET level, the control limit should be tied to that observed outcome.
That is where nanomaterial BET analysis delivers real value: not as a generic descriptor, but as a bridge between structural characterization and operating decisions.
The practical takeaway
BET analysis remains one of the most useful and defensible tools for comparing nanomaterial surface area, especially when powders or particles cannot be meaningfully judged by particle size data alone. Its strength lies in exposing accessible surface differences caused by porosity, processing history, and agglomeration behavior. For technical evaluators, that makes it highly relevant to benchmarking, second-source qualification, and process troubleshooting.
Its limitation is just as important. BET does not tell the whole story, and materials with attractive m²/g values may still underperform if the surface is inaccessible, chemically unsuitable, or operationally unstable. The most credible evaluations therefore combine BET with morphology, pore structure, preparation history, and application-level performance data.
In industrial decision-making, that balanced approach is usually the difference between a surface area number that decorates a datasheet and one that genuinely improves material selection.
Related News
How to verify part consistency before choosing a 3D printing OEM
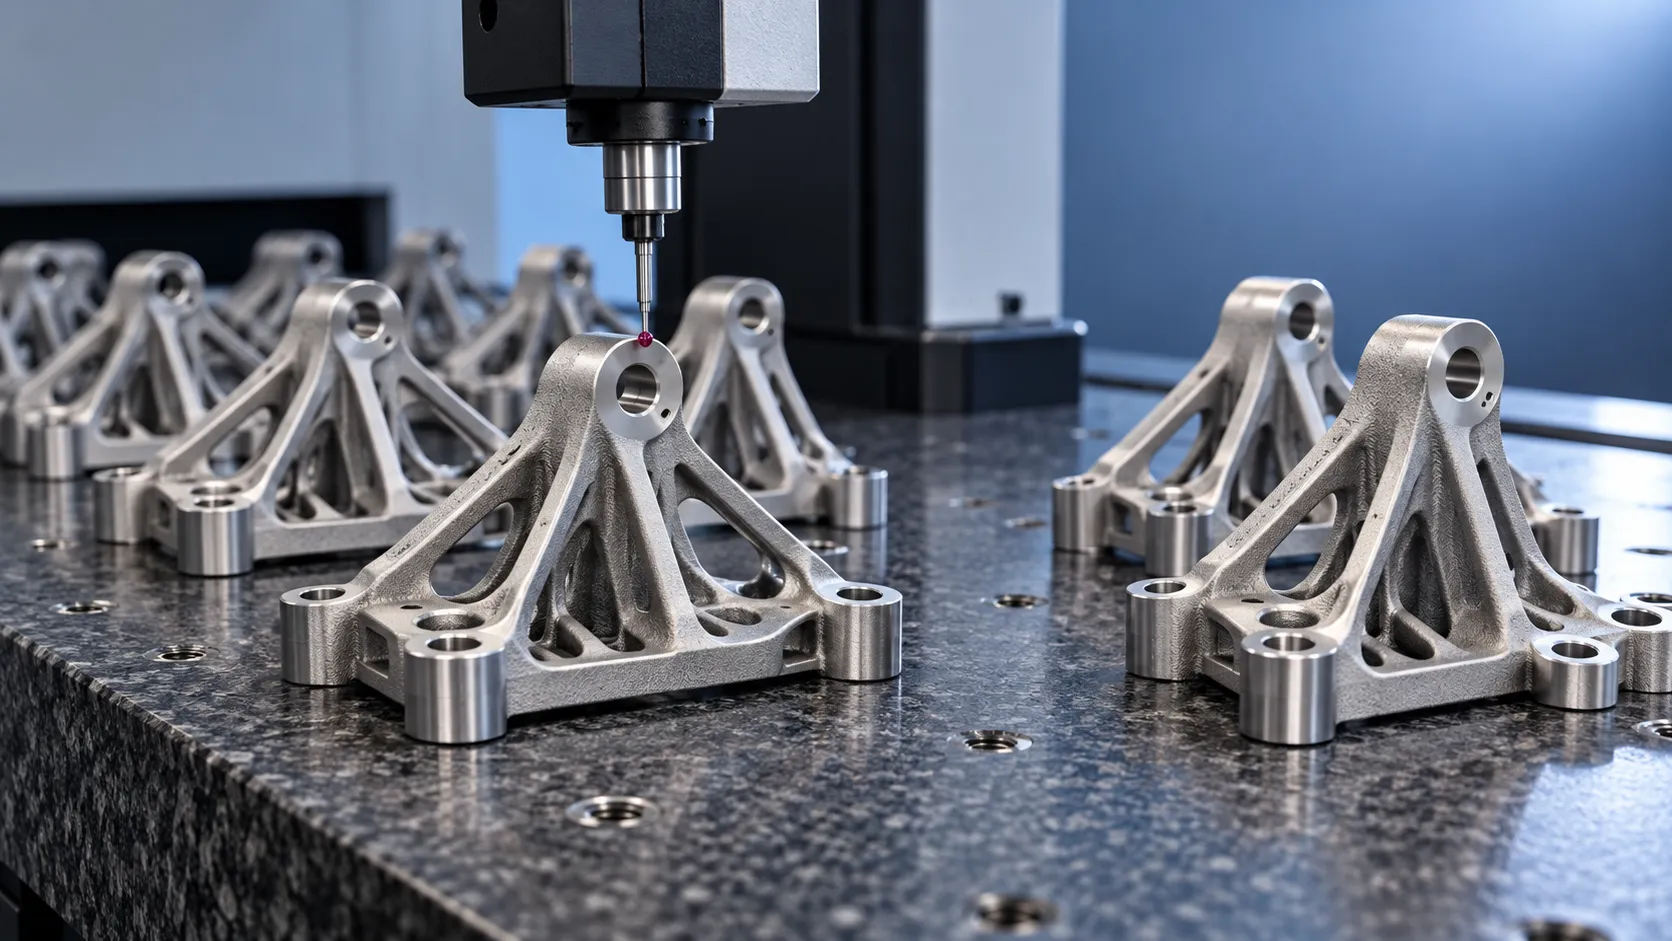
Choosing a 3D printing OEM? Learn how to verify part consistency with repeat-build trials, validated inspections, and traceability checks before committing to production.
How does a rigid cryogenic transfer line handle thermal contraction?
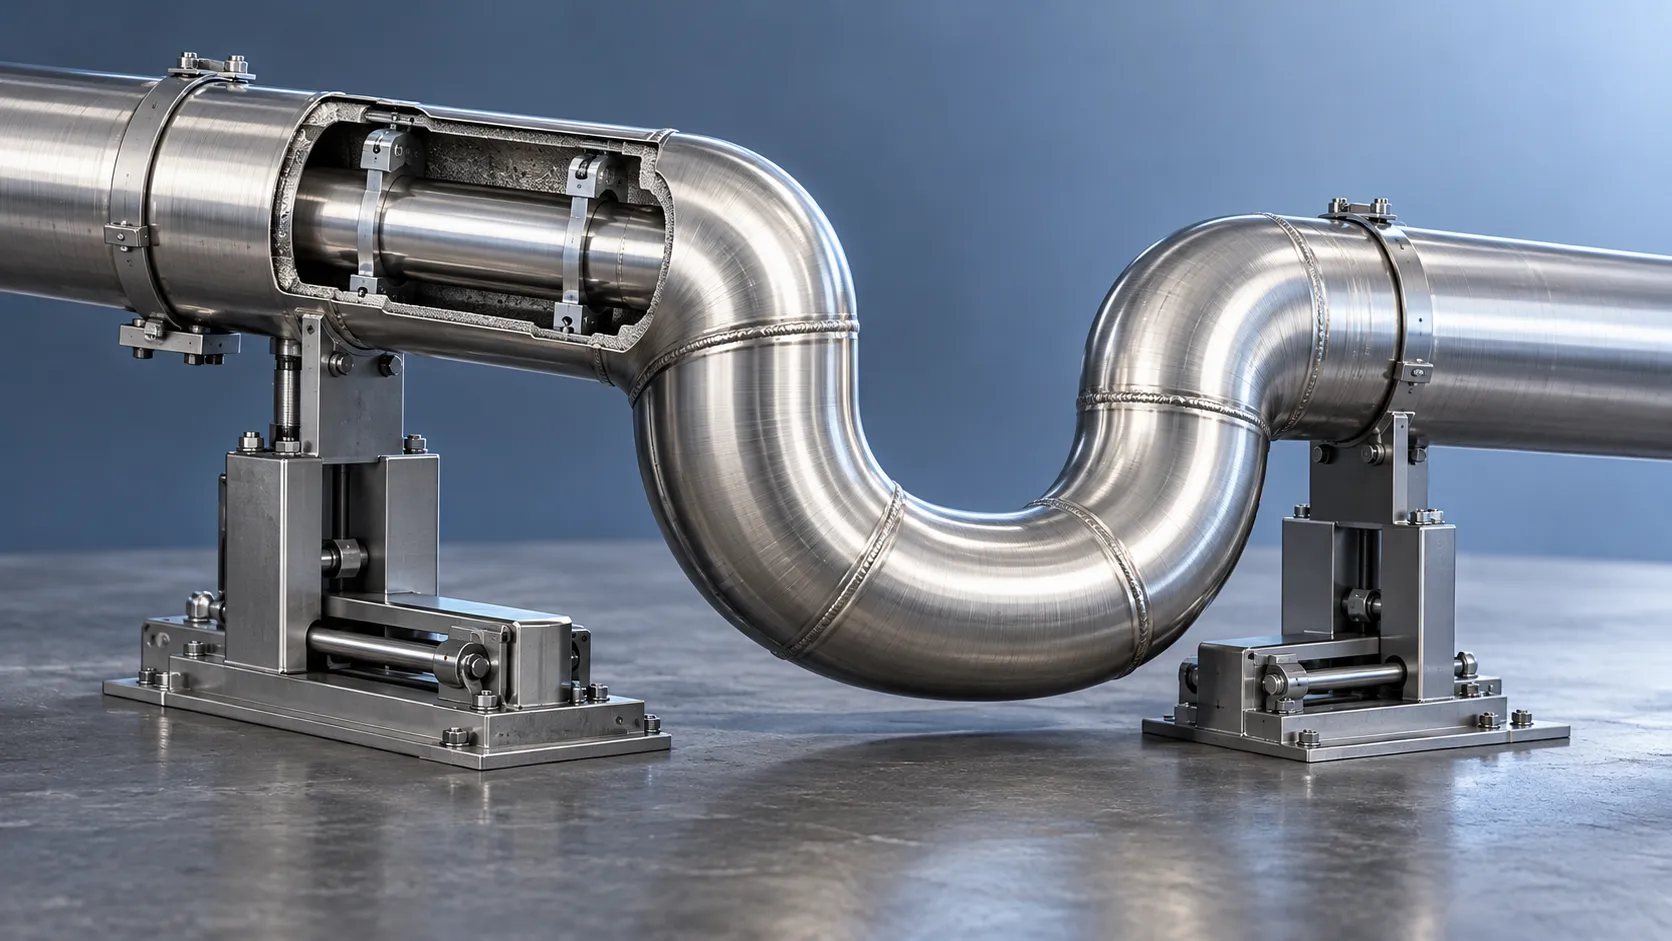
Learn how a rigid cryogenic transfer line manages thermal contraction with bends, bellows, and guided supports. Discover key design checks for safe, reliable cryogenic performance.
How much does edge vision deployment cost beyond the hardware?
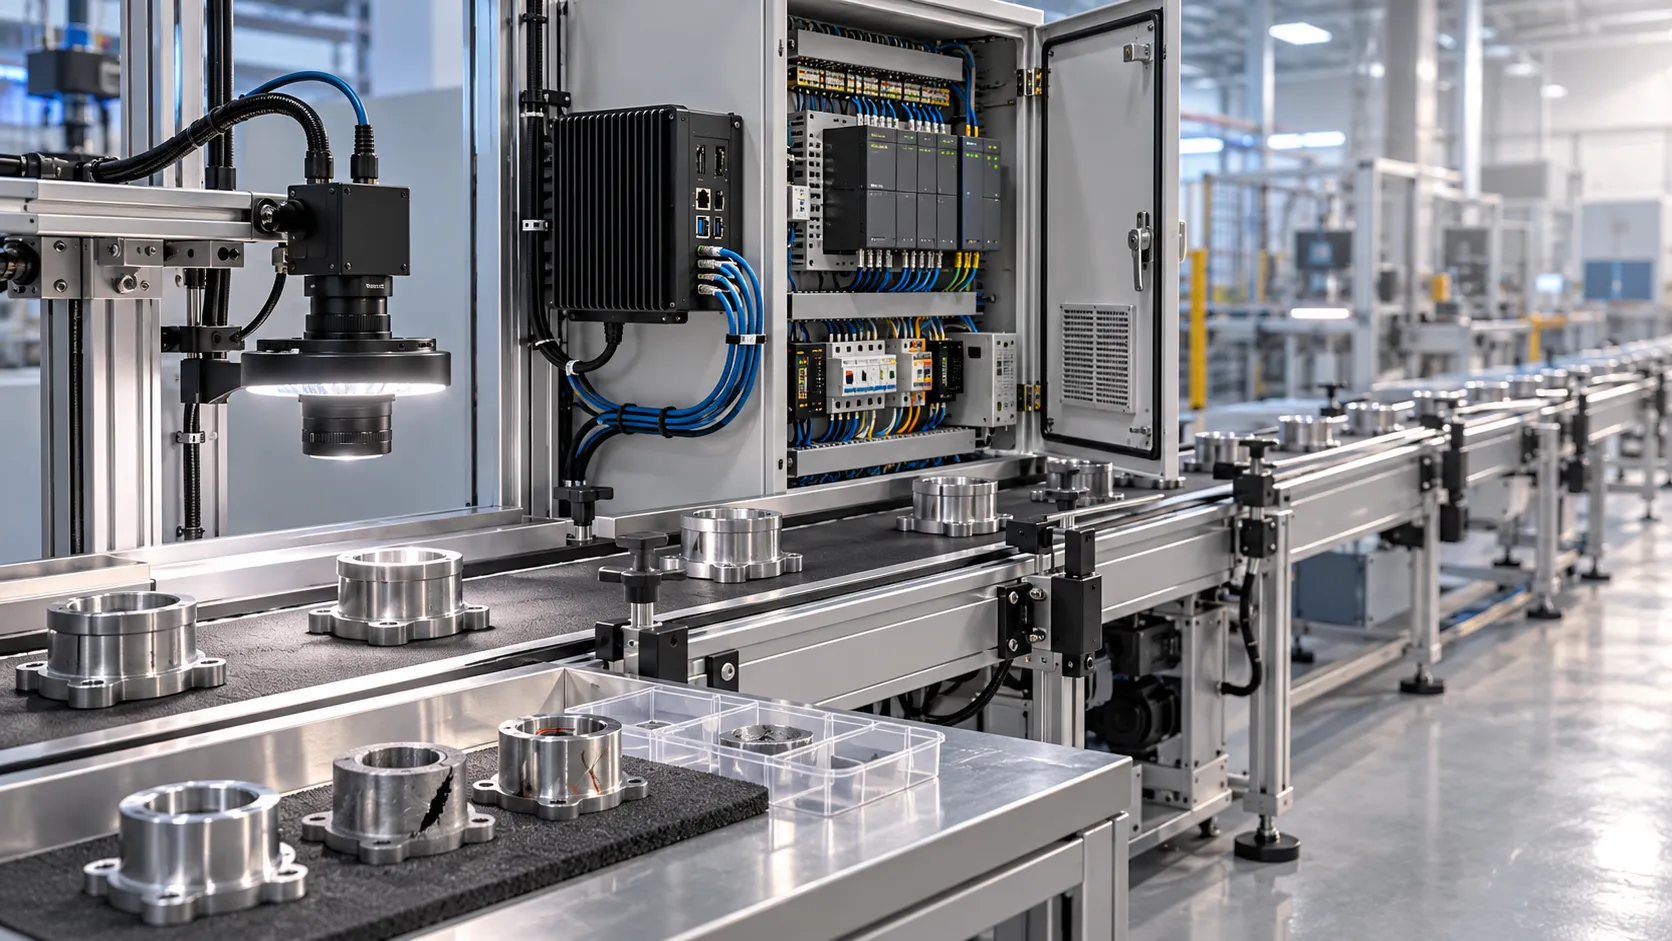
Understand edge vision deployment cost beyond hardware, from data and integration to security and support. Uncover hidden expenses and build a smarter lifecycle budget before you scale.
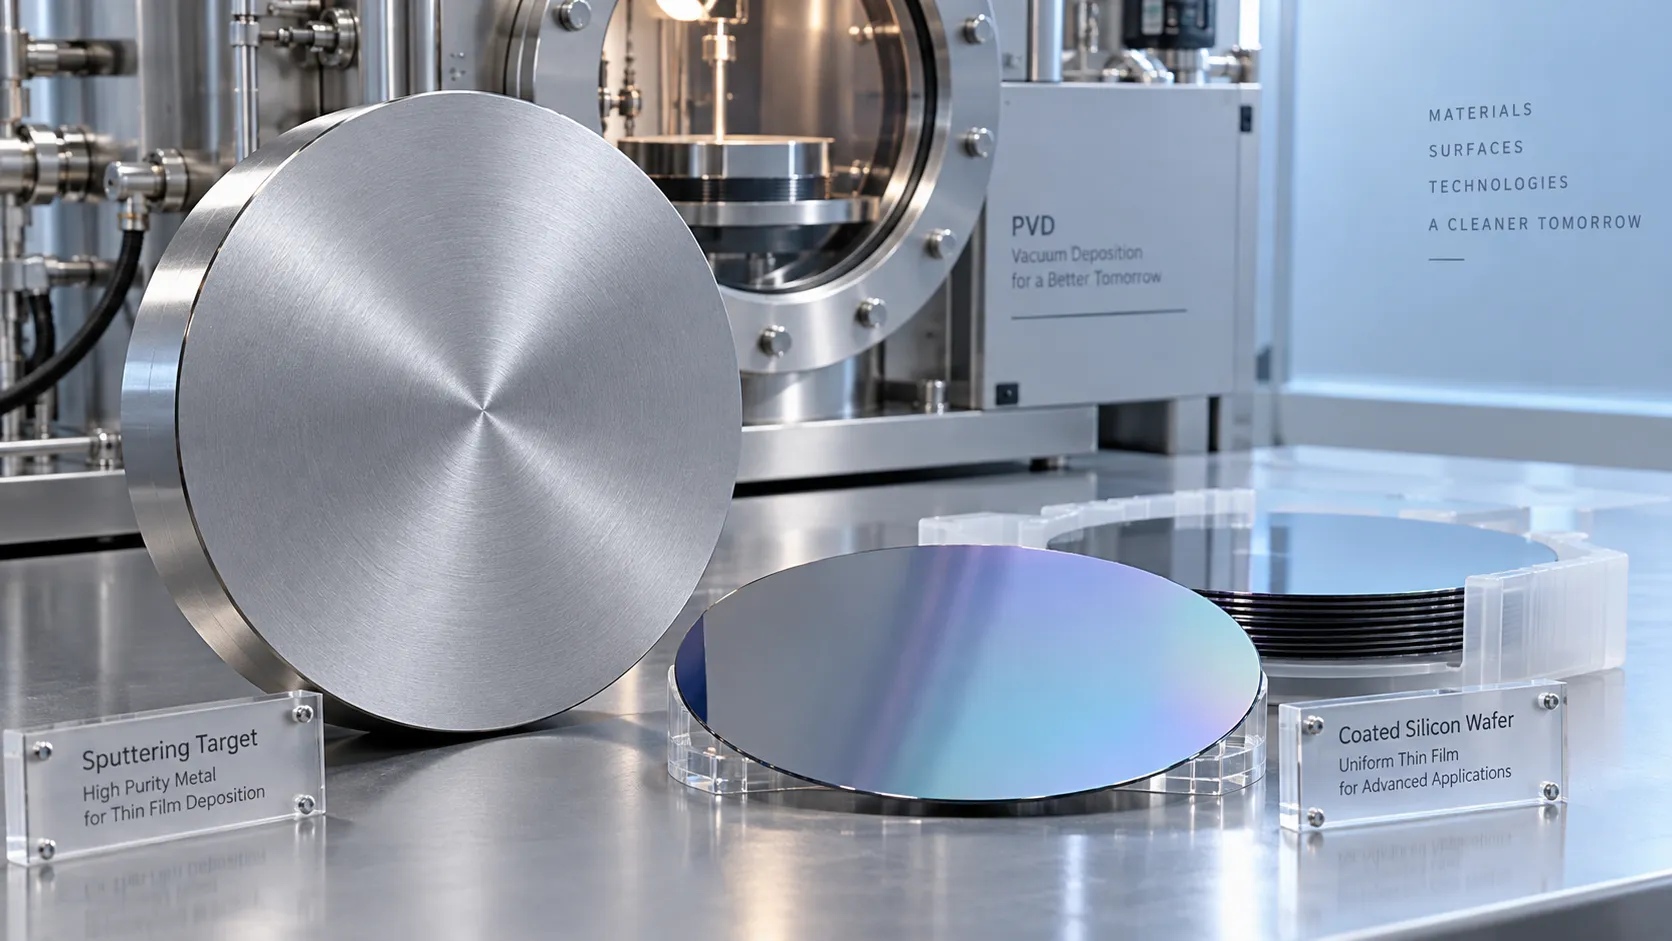
How does the purity of sputtering targets affect thin-film quality?
Discover how sputtering targets affect thin-film quality. Learn to assess purity, identify harmful impurities, and choose specifications that improve coating performance.
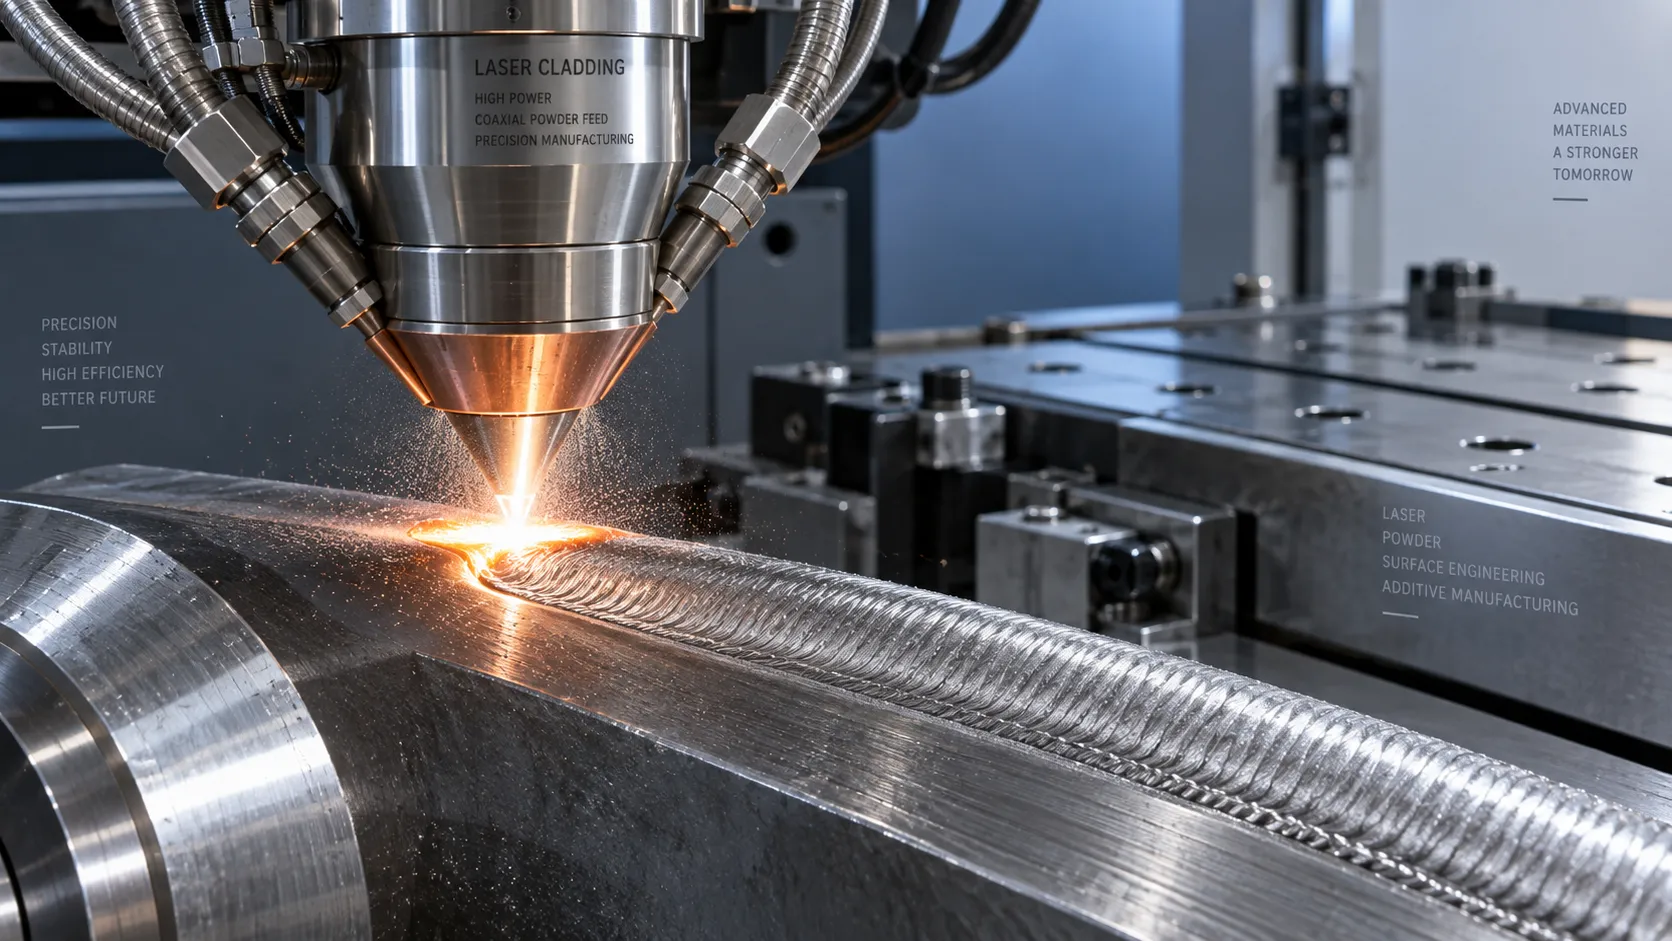
How high power laser cladding systems control substrate dilution
Discover how high power laser cladding systems control substrate dilution through beam shaping, material feed, and thermal management to deliver reliable bonds and coating performance.

How to check HS codes for customs compliance in international logistics
Strengthen international logistics customs compliance: learn how to verify HS codes, check official tariffs, and document classifications to reduce costly shipment delays.
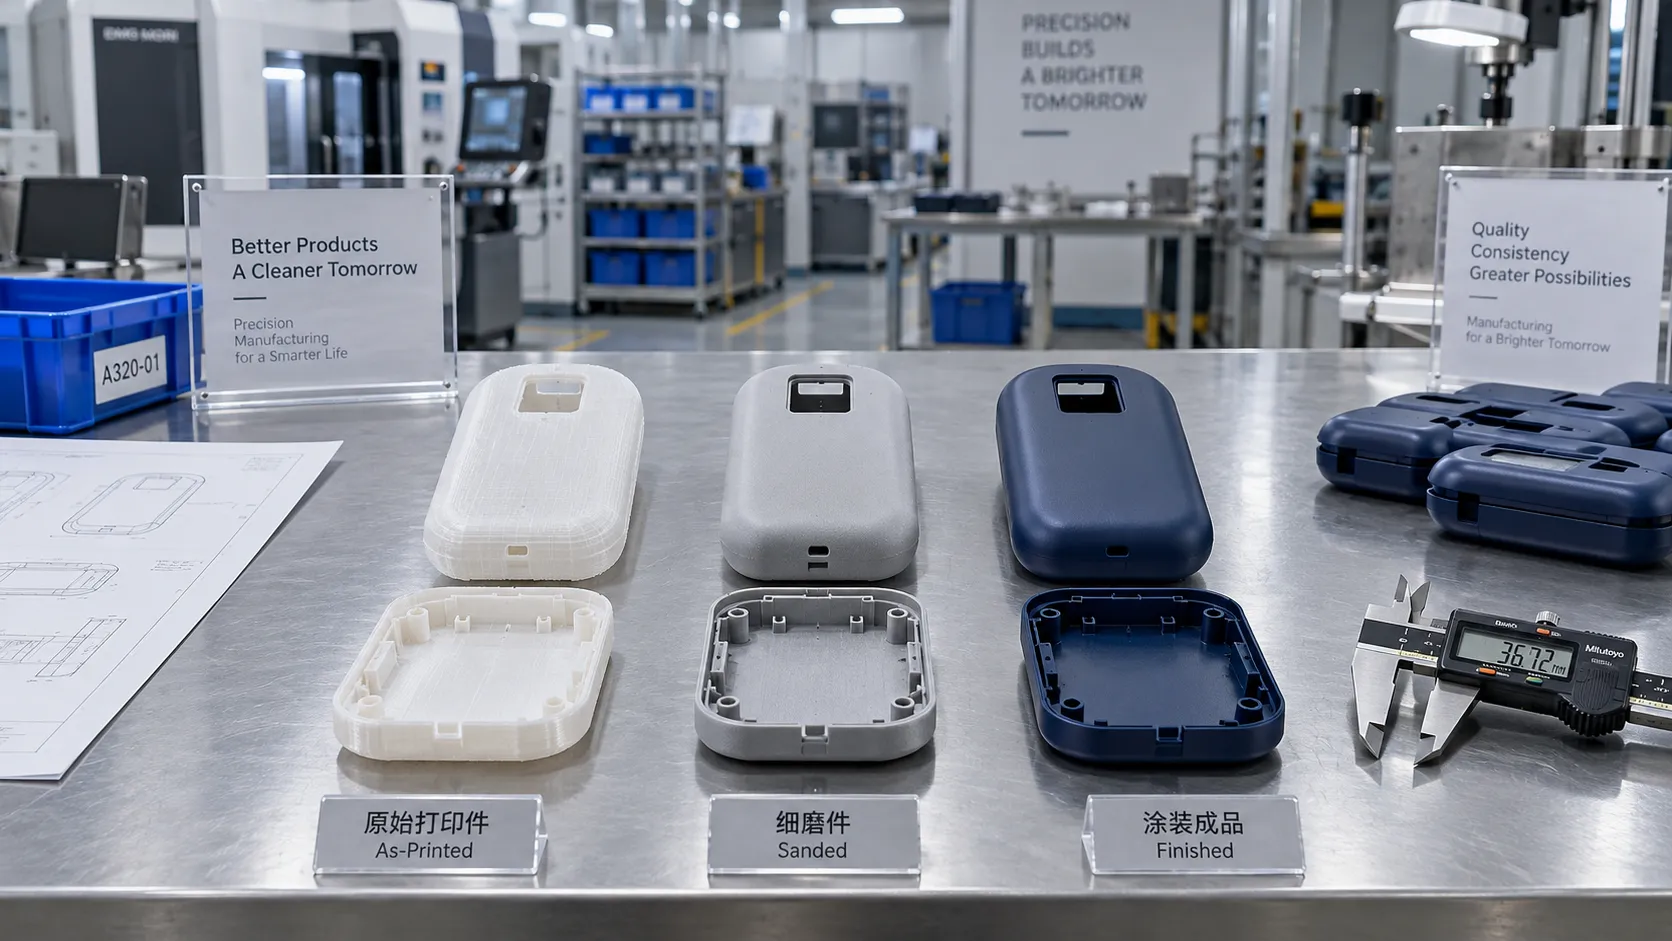
Choosing a 3D Printing Service for Consumer Products: Finish, Fit, and Cost
Compare 3d printing consumer good services by finish, fit, materials, and total cost. Learn how to choose a reliable supplier and avoid costly defects before ordering.
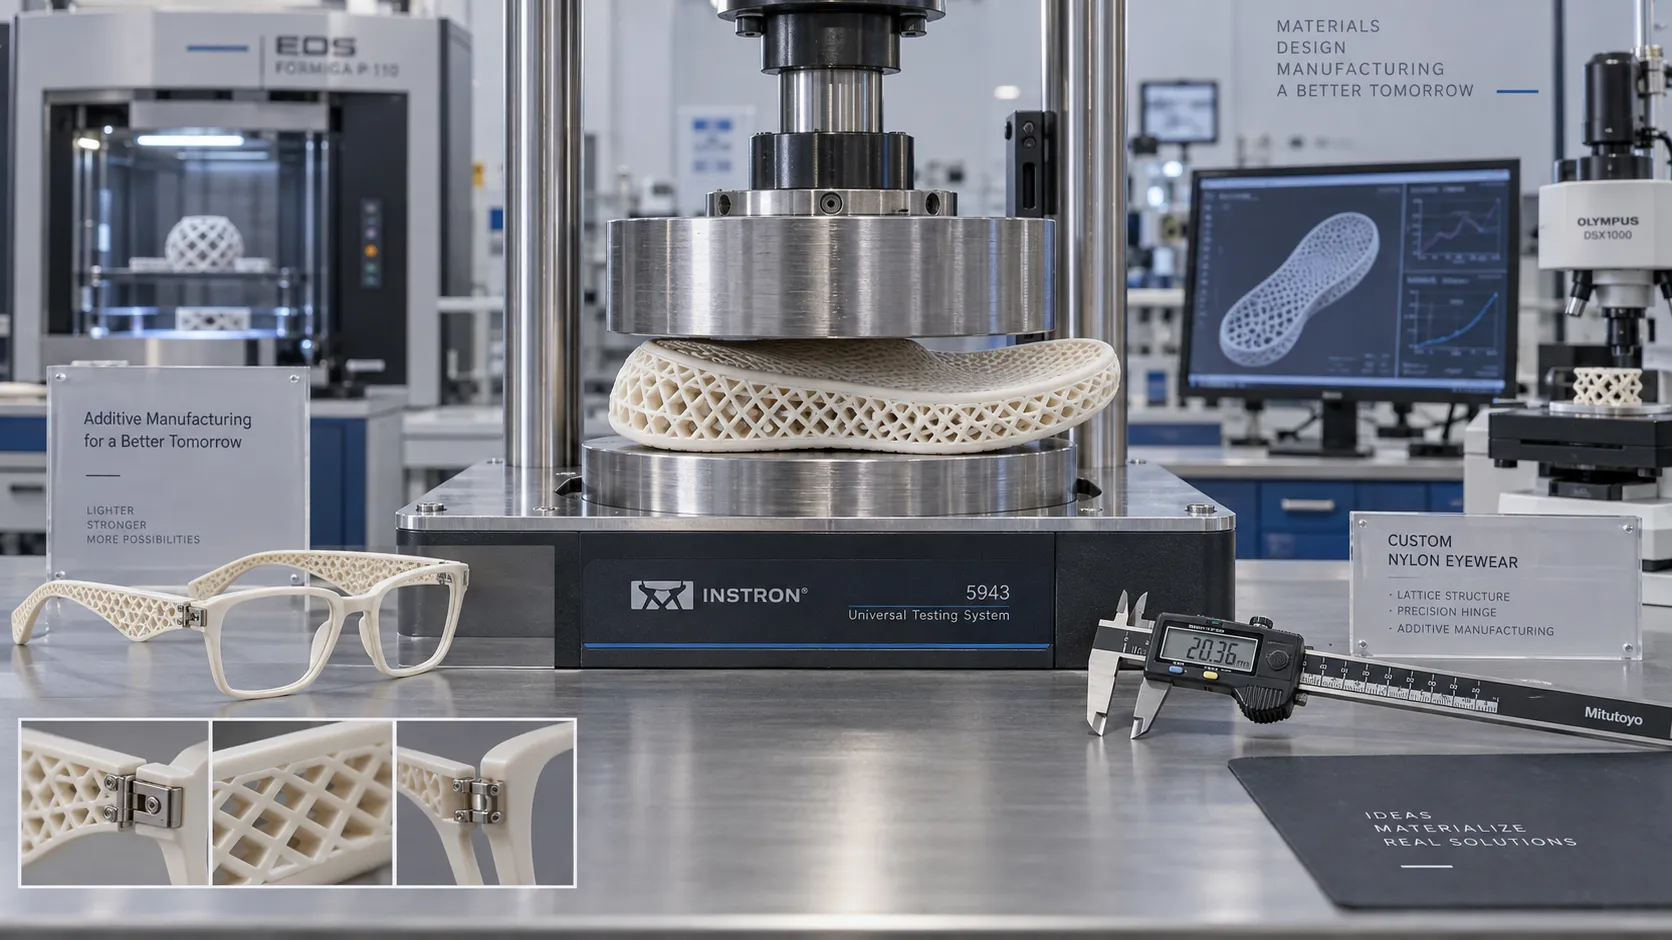
Which Consumer Goods Can Be 3D Printed, and What Are the Practical Limits?
Explore 3d printing consumer goods, from custom eyewear to replacement parts. Discover practical limits on materials, safety, and costs to make smarter production decisions.
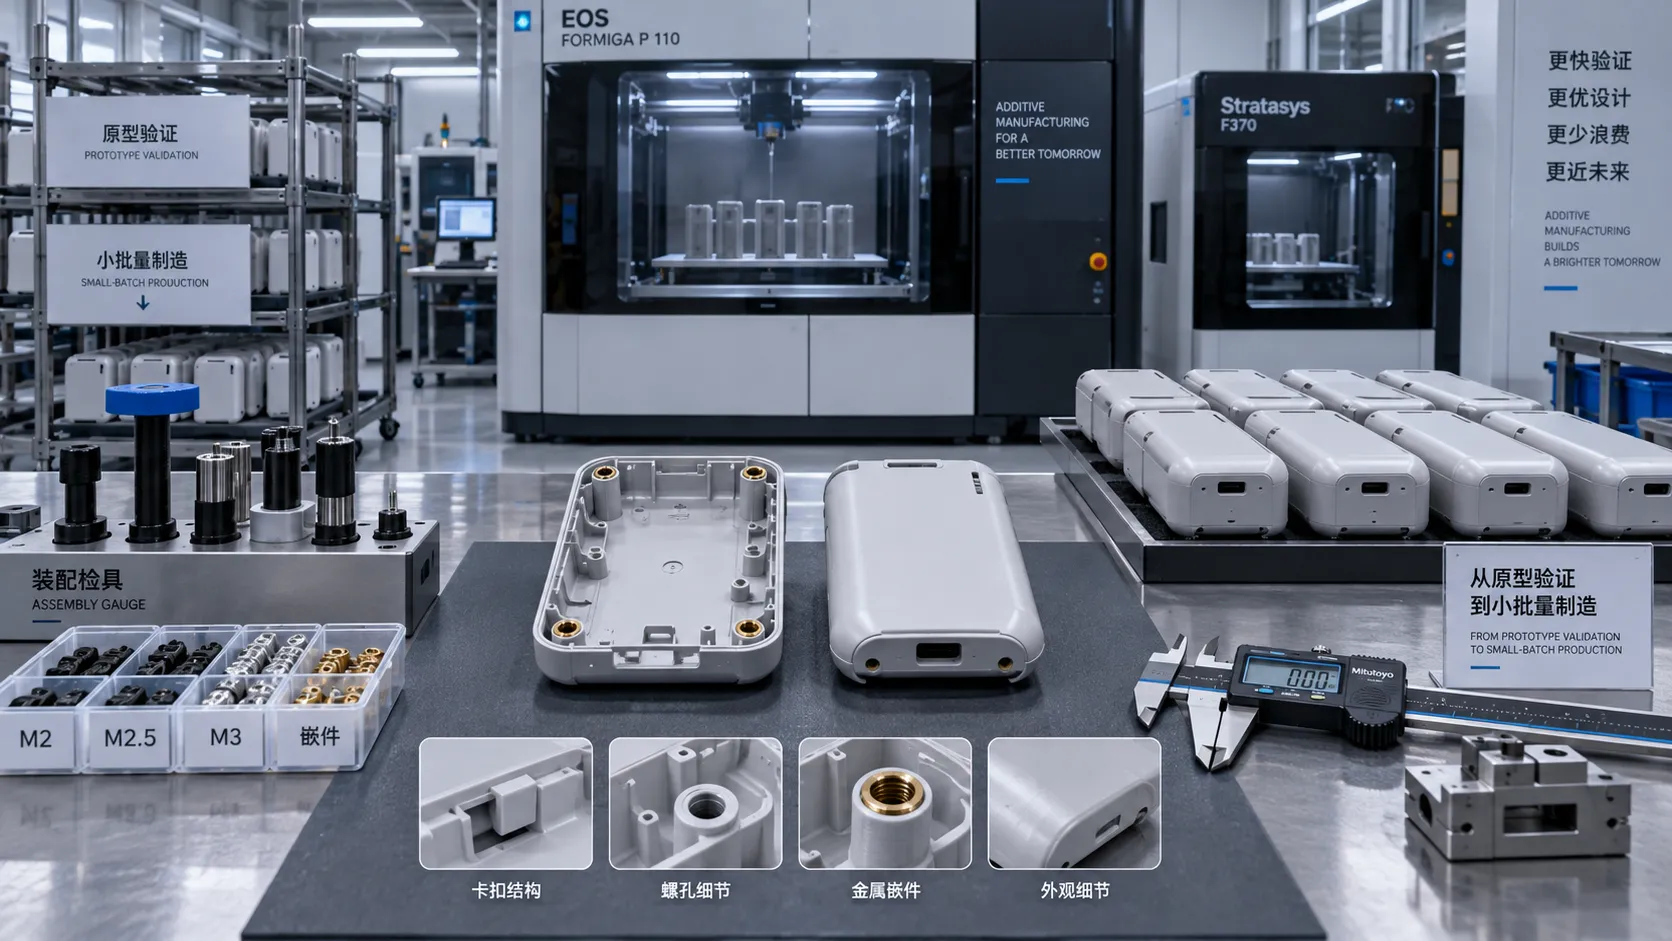
From Prototype to Small Batch: Applying 3D Printing to Consumer Goods
Explore 3d printing in consumer goods: learn how to move from prototype to small-batch production with practical guidance on materials, quality validation, and cost control.
Related News
- 00
0000-00
How to verify part consistency before choosing a 3D printing OEM - 00
0000-00
How does a rigid cryogenic transfer line handle thermal contraction? - 00
0000-00
How much does edge vision deployment cost beyond the hardware? - 00
0000-00
How does the purity of sputtering targets affect thin-film quality? - 00
0000-00
How high power laser cladding systems control substrate dilution
Dr. Elena Carbon
Weekly Insights
Stay ahead with our curated technology reports delivered every Monday.