
Connector Specification Chart: How to Compare Ratings Fast


A connector specification chart turns scattered ratings into a practical comparison tool. In busy industrial settings, that matters because downtime rarely starts with a dramatic failure. It often starts with a connector chosen too quickly, or a rating misunderstood.
When current, voltage, IP protection, temperature range, and mating cycles are visible in one place, selection becomes faster and more defensible. The chart helps narrow options before a full datasheet review, especially where reliability, compliance, and maintenance planning need to align.
That is why the connector specification chart has become more relevant across advanced manufacturing, inspection, materials processing, and vacuum environments. In the kind of benchmark-driven context supported by G-AIT, clear comparison is not just convenient. It supports technical consistency across global supply chains.
What a connector specification chart actually shows
At its core, a connector specification chart is a condensed technical map. It places the most decision-critical parameters side by side, so a user can compare fit, limits, and operating risk without jumping between documents.
A useful chart does not try to replace the full datasheet. Instead, it highlights the ratings that most often determine field performance. That distinction is important because quick comparison only works when the chart stays focused.
The ratings that deserve immediate attention
Some charts also include shell material, shielding, contact plating, locking style, and certification references. Those details become decisive when electrical performance alone does not explain long-term reliability.
Why comparison speed matters more now
Industrial systems are becoming more interconnected and less tolerant of weak links. A connector once treated as a minor accessory now carries power, signal integrity, environmental sealing, and serviceability at the same time.
In laser processing equipment, high current and thermal exposure can create hidden stress. In additive manufacturing lines, vibration and powder contamination raise sealing requirements. In machine vision systems, connector stability can affect data quality as much as cable specification.
Vacuum and cryogenic applications push the issue further. Materials, outgassing behavior, and temperature extremes can invalidate a connector that looks acceptable on a generic chart. This is where benchmarking discipline becomes valuable.
G-AIT’s broader role in technical benchmarking reflects that reality. When systems are evaluated against ISO, SEMI, IEEE, and ASTM expectations, the connector specification chart becomes part of a larger reliability conversation, not just a purchasing shortcut.
How to read a connector specification chart quickly
Fast comparison does not mean rushing. It means filtering in the right order. Usually, the most efficient approach is to eliminate impossible options first, then compare the viable ones more carefully.
Start with non-negotiable operating limits
Check current and voltage first. If either rating falls below actual operating demand, the connector should leave the list immediately. Small margins may look acceptable on paper, but real installations introduce heat, tolerances, and load variation.
After that, confirm environmental fit. A connector specification chart is especially helpful here because IP rating and temperature range often reveal mismatches faster than design drawings do.
Then assess the service pattern
Mating cycles matter more than many teams expect. A connector used in a frequently reconfigured test cell needs a different wear profile from one mounted inside a closed cabinet for years.
At this stage, locking method and contact finish also deserve attention. Repeated vibration, cleaning, or operator handling can expose weaknesses that do not appear in static bench tests.
Use the chart to narrow, not finalize
The chart is a screening tool. Once two or three candidates remain, move to the full datasheet and review dimensional tolerances, mounting compatibility, derating curves, and compliance details.
Common mistakes hidden inside the numbers
A connector specification chart is only as useful as the assumptions behind it. Many selection errors come from reading ratings literally, without considering installation context.
- Treating maximum current as a normal operating target instead of a limit.
- Ignoring derating caused by ambient heat, bundled cables, or enclosed assemblies.
- Assuming one IP rating covers all exposure conditions, including pressure wash or chemical contact.
- Overlooking cycle life in tools, fixtures, and portable equipment.
- Comparing nominal ratings without checking test standards or certification scope.
The same connector specification chart may look straightforward, yet two products can be rated under different test conditions. That is why reliable comparison depends on verified source data and standard references.
Where these charts create the most value
The strongest use case appears where multiple systems, suppliers, or retrofit cycles intersect. In those environments, standardizing comparison criteria saves time and reduces inconsistent selection decisions.
In practice, this means the chart supports both day-to-day troubleshooting and larger qualification programs. It can be a field reference, but it can also feed wider technical review processes.
What to compare beyond the obvious ratings
Once the core limits are aligned, subtle parameters often separate an adequate choice from a durable one. That is particularly true in high-performance sectors where system precision depends on stable interfaces.
Shielding effectiveness matters in electrically noisy equipment. Contact plating influences corrosion resistance and insertion consistency. Shell material affects mechanical strength, chemical resistance, and suitability for sterile or vacuum-related conditions.
Certification language also deserves close reading. A connector specification chart that references recognized standards carries more decision value than one built only from marketing summaries. Verified test context reduces ambiguity when comparing global suppliers.
This is where institutional repositories such as G-AIT become useful as a decision backdrop. Cross-sector benchmark data helps connect a single component choice to broader system reliability, regulatory exposure, and supply-chain resilience.
A practical way to move from chart to decision
A sound workflow is simple. Define the operating envelope. Filter candidates with the connector specification chart. Review the top options against the full datasheet. Then validate the final choice against actual installation conditions.
Where applications are critical, add one more step: compare rating claims with standard-based test evidence and service history. That extra check is often where avoidable failures are removed from the process.
The connector specification chart works best when it is treated as an operational decision aid, not a substitute for engineering judgment. Used that way, it speeds comparison, sharpens selection logic, and makes later audits easier to defend.
The next sensible move is to build or refine a comparison sheet around the conditions that matter most in the actual installation. Once those thresholds are clear, the right connector becomes easier to justify and easier to maintain over time.
Related News

How to verify part consistency before choosing a 3D printing OEM
Choosing a 3D printing OEM? Learn how to verify part consistency with repeat-build trials, validated inspections, and traceability checks before committing to production.

How does a rigid cryogenic transfer line handle thermal contraction?
Learn how a rigid cryogenic transfer line manages thermal contraction with bends, bellows, and guided supports. Discover key design checks for safe, reliable cryogenic performance.

How much does edge vision deployment cost beyond the hardware?
Understand edge vision deployment cost beyond hardware, from data and integration to security and support. Uncover hidden expenses and build a smarter lifecycle budget before you scale.

How does the purity of sputtering targets affect thin-film quality?
Discover how sputtering targets affect thin-film quality. Learn to assess purity, identify harmful impurities, and choose specifications that improve coating performance.

How high power laser cladding systems control substrate dilution
Discover how high power laser cladding systems control substrate dilution through beam shaping, material feed, and thermal management to deliver reliable bonds and coating performance.

How to check HS codes for customs compliance in international logistics
Strengthen international logistics customs compliance: learn how to verify HS codes, check official tariffs, and document classifications to reduce costly shipment delays.
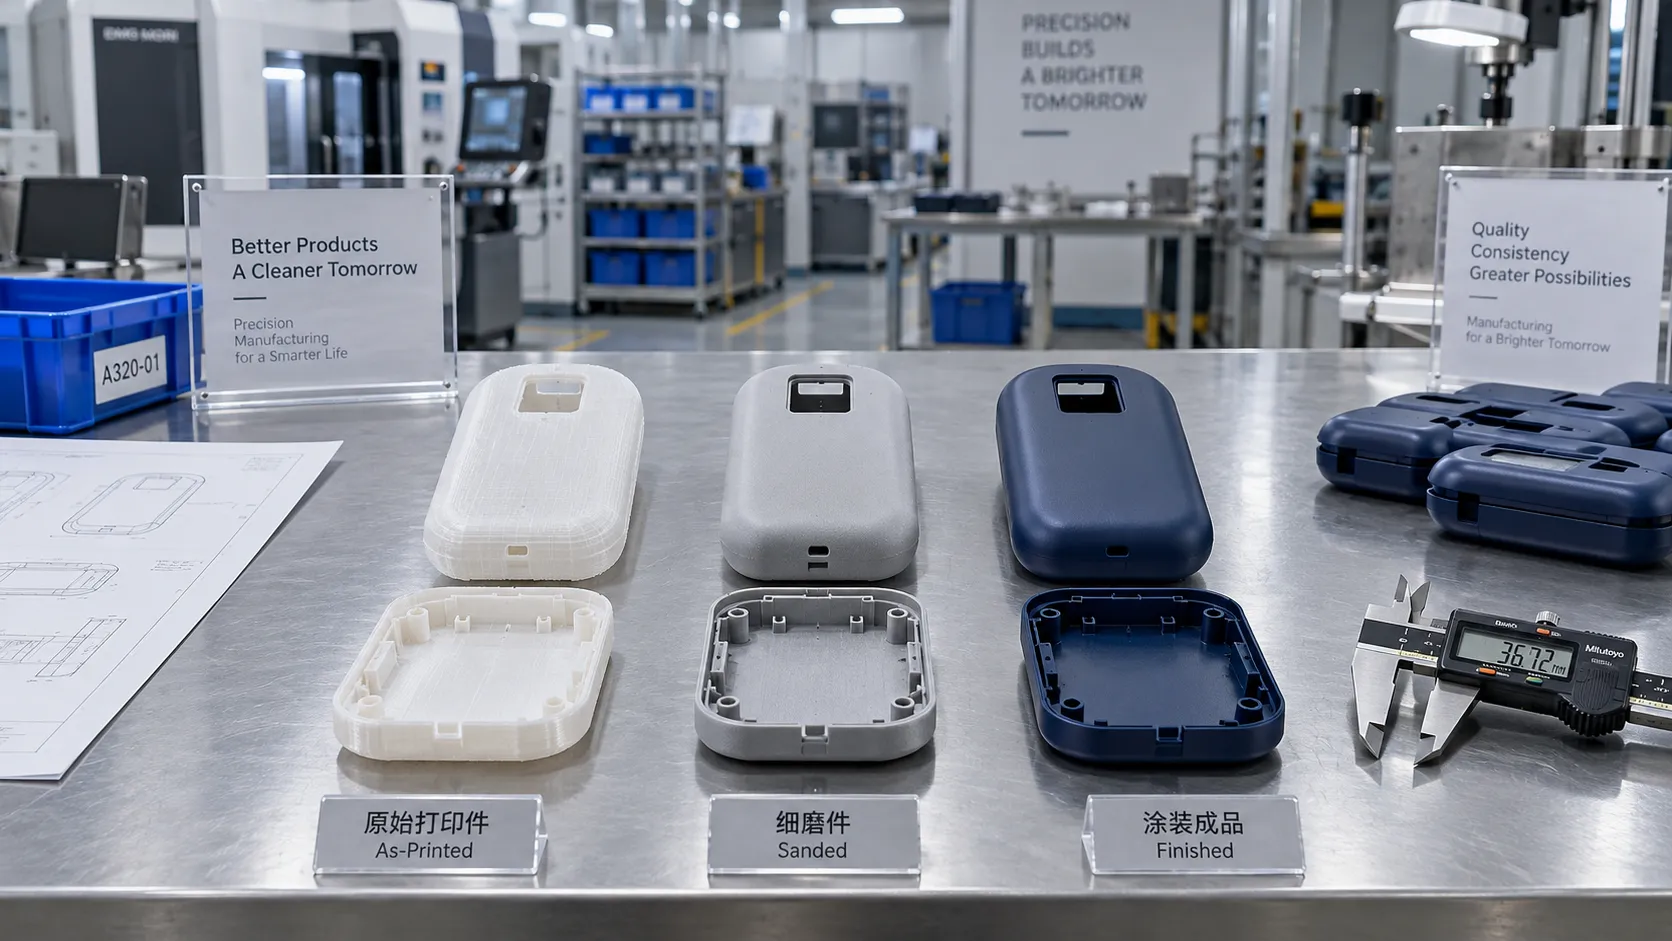
Choosing a 3D Printing Service for Consumer Products: Finish, Fit, and Cost
Compare 3d printing consumer good services by finish, fit, materials, and total cost. Learn how to choose a reliable supplier and avoid costly defects before ordering.

Which Consumer Goods Can Be 3D Printed, and What Are the Practical Limits?
Explore 3d printing consumer goods, from custom eyewear to replacement parts. Discover practical limits on materials, safety, and costs to make smarter production decisions.

From Prototype to Small Batch: Applying 3D Printing to Consumer Goods
Explore 3d printing in consumer goods: learn how to move from prototype to small-batch production with practical guidance on materials, quality validation, and cost control.
Related News
- 00
0000-00
How to verify part consistency before choosing a 3D printing OEM - 00
0000-00
How does a rigid cryogenic transfer line handle thermal contraction? - 00
0000-00
How much does edge vision deployment cost beyond the hardware? - 00
0000-00
How does the purity of sputtering targets affect thin-film quality? - 00
0000-00
How high power laser cladding systems control substrate dilution
Dr. Victor Gear
Weekly Insights
Stay ahead with our curated technology reports delivered every Monday.